
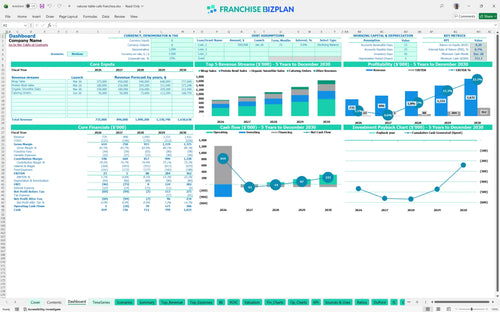
All-in-one Dashboard
Core inputs and core outputs


This best financial model template for restaurant franchise units provides a professional-grade framework to forecast revenue, manage expenses, and calculate investor returns with total confidence.
Core inputs and core outputs
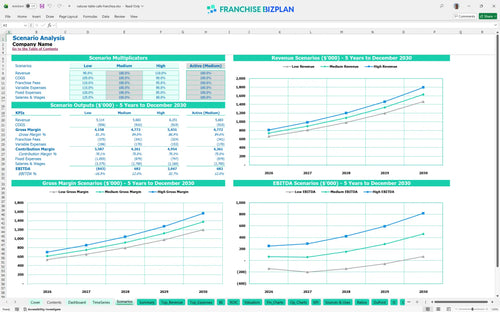
Three scenario analysis
Presentation ready
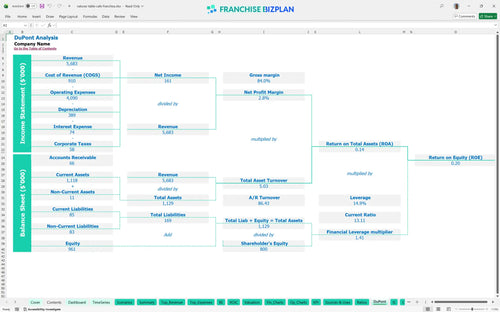
DuPont analysis
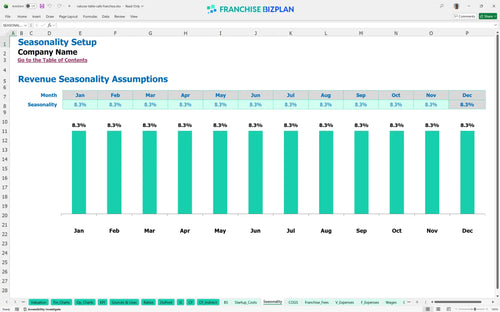
Researched revenue assumptions
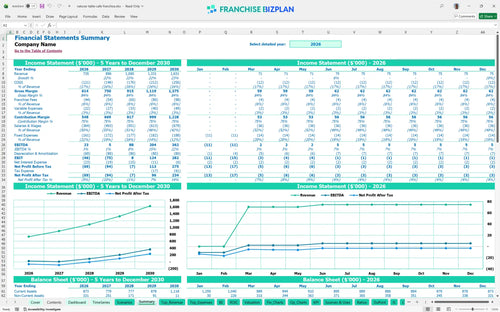
Lender-friendly financial outputs
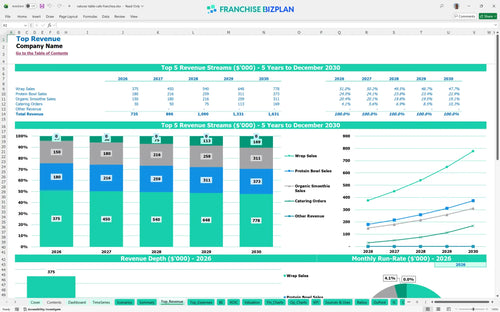
Revenue stream detailed view
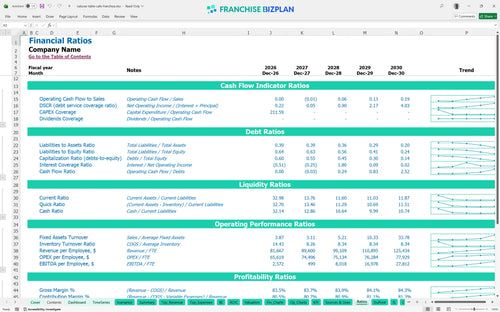
Performance metrics benchmark
We built this franchise unit financial model using our own research into the unit economics of healthy fast-casual dining. Key assumptions for revenue streams like Wrap Sales and Protein Bowls, plus expenses like the $30,000 franchise fee and 5% royalty, are pre-populated and fully editable. This tool defintely helps you move from 'guessing' to 'knowing' by showing how Year 1 EBITDA of $23,000 can scale as your catering and walk-in traffic grows.
The unit reaches a positive EBITDA of $23,000 in the first year, but true proffitability scales significantly by Year 5, reaching $362,000. This growth is driven by a steady climb in annual revenue from $735,000 to over $1.6 million as the brand matures in the local market. This franchise unit profit and loss statement example shows that managing food costs down from 14% to 13.2% is key to widening that margin.
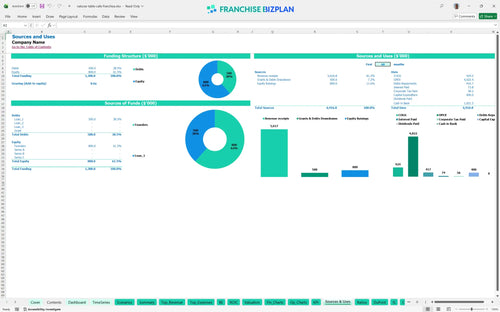
You will need approximately $400,000 to launch this unit, covering everything from the initial franchise fee to opening inventory. Here is how to calculate franchise startup costs: the largest outlays are $180,000 for leasehold improvements and $90,000 for kitchen equipment. This total investment ensures the facility meets brand standards and is ready for high-volume throughput from day one.
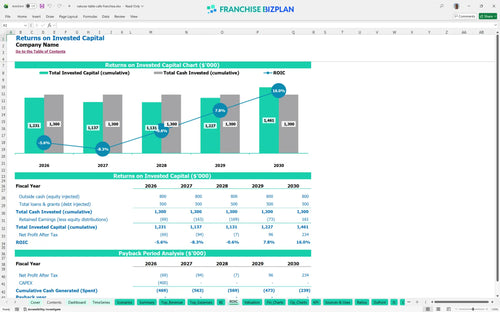
Investors can expect an Internal Rate of Return (IRR) of 65% and a Return on Equity (ROE) of 20% based on the 5-year forecast. While the initial cash outlay is significant, the business generates substantial cash flow in later years, though full payback of the initial capital occurs after Year 5. Estimating ROI for food franchise units requires looking at this long-term EBITDA growth to see the real value.
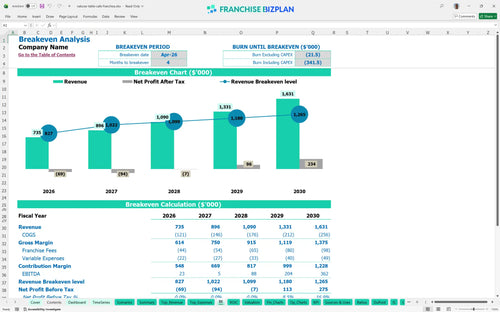
The unit hits its break-even date in April 2026, just 4 months after the initial launch. This franchise unit feasibility study template shows that the $9,000 monthly rent is the primary fixed cost hurdle you must clear. Reaching this point quickly depends on hitting your early traffic targets for organic smoothies and wraps to cover the fixed labor and occupancy costs.
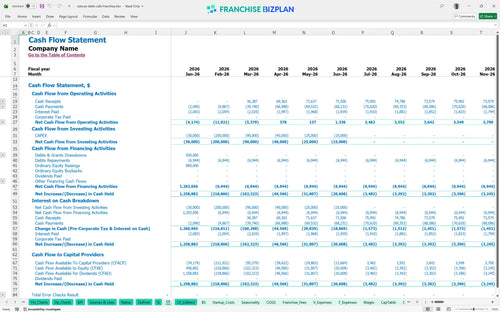
The lowest cash point is projected at $712,000 in December 2028, which indicates the model assumes a significant initial funding round or loan to maintain a safe buffer. This restaurant franchise cash flow forecast suggests you have plenty of runway, but you should still monitor the timing of your $400,000 CAPEX spend. Keeping a tight grip on opening inventory and pre-opening labor will prevent early cash leaks.
This fast-casual restaurant financial projection template allows you to toggle between performance levels to see how a 10% drop in revenue affects your 65% IRR. In a high-growth scenario, increasing catering orders from $30,000 to $168,000 over five years dramatically shifts the peak cash need and year-one margin. Understanding these swings helps you prepare for the volatility of the Austin food scene.
Finance: update unit break-even and payback model by Friday
This franchise financial model is a complete Excel-based toolkit designed for precision and flexibility. You can adjust every variable in this franchise unit profit and loss template, from local labor rates to specific ingredient costs, using pre-filled formulas that eliminate manual math errors. It is the most efficient restaurant franchise business plan excel tool for testing how different operating scenarios impact your bottom line before you sign a lease.

Planning for long-term growth requires more than just a one-year snapshot. This restaurant franchise financial projection maps out your journey from a $735,000 year-one start to a projected $1,631,000 in year five. By analyzing these franchise unit economics over a sixty-month horizon, you can see exactly how scaling sales of protein bowls and wraps changes your store-level margin as fixed costs stabilize.

Franchise royalty fees and brand fund contributions can squeeze margins if not modeled correctly. This tool provides a clear franchise operational cost breakdown, accounting for the 5% royalty and 1% marketing fee against your total sales. It ensures you know exactly how much cash stays in the unit after the franchisor takes their cut, which is vital for maintaining a healthy debt service coverage ratio.

Estimating your total entry cost is the first step to avoiding a capital crunch. This franchise investment calculator aggregates your franchise startup costs, including the $30,000 initial fee and $180,000 in leasehold improvements, to find your total cash requirement. The integrated break-even analysis then tells you the exact month your sales volume covers both your $9,000 monthly rent and variable operating expenses.

This healthy fast-casual franchise financial model uses researched data to set realistic expectations for restaurant operational expenses. We have included benchmarks for food ingredients, which start at 14% of sales, and labor costs for a full team of kitchen and front-of-house staff. These figures help you sanity-check your assumptions against industry standards to ensure your pro forma is grounded in reality.


Simply purchase and download the financial model template, then access it instantly using Microsoft Excel or Google Sheets. No installation or technical expertise required-just open and start working.

Enter your business-specific numbers, including revenue projections, costs, and investment details. The pre-built formulas will automatically calculate financial insights, saving you time and effort.

Leverage the investor-ready format to confidently showcase your financial projections to banks, franchise representatives, or investors. Impress stakeholders with clear, data-driven insights and professional reports.

Leverage the investor-ready format to confidently present your projections to banks, franchise representatives, or investors.