
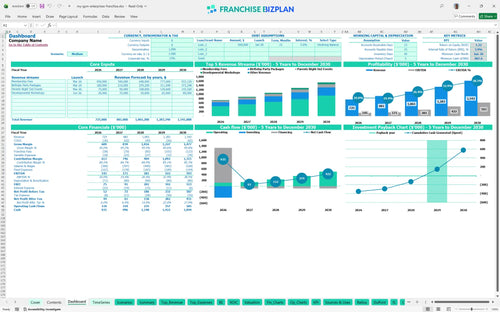
All-in-one Dashboard
Core inputs and core outputs


This comprehensive Excel template includes integrated income statements, cash flow forecasts, and CAPEX schedules designed specifically for evaluating a children's fitness franchise unit.
Core inputs and core outputs
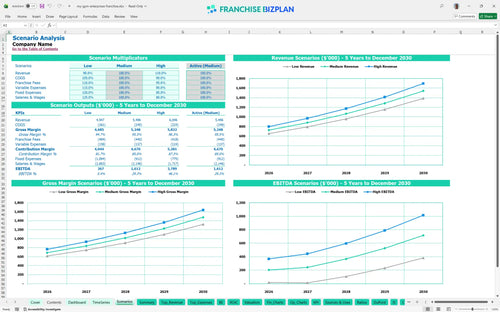
Three scenario analysis
Presentation ready
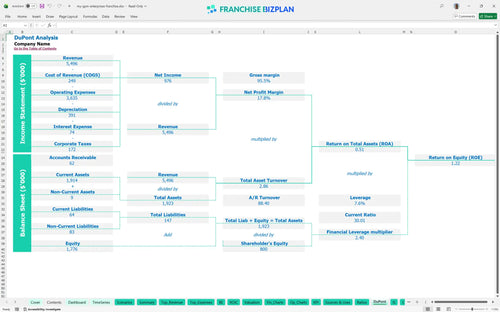
DuPont analysis
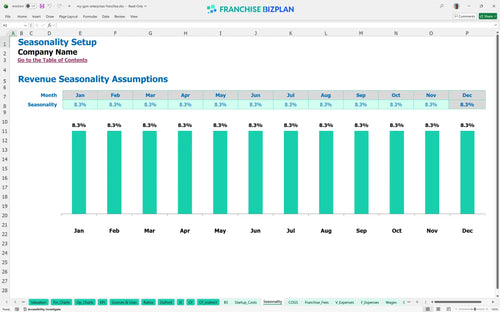
Researched revenue assumptions
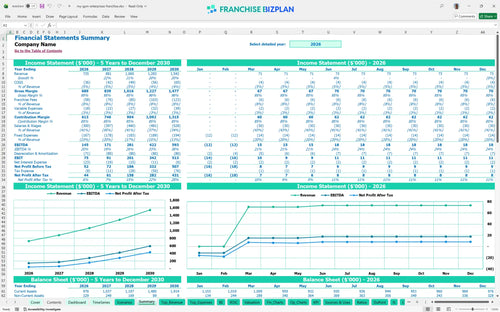
Lender-friendly financial outputs
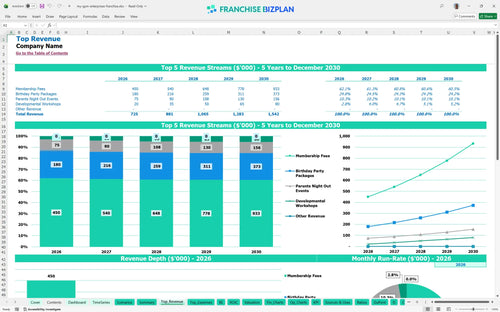
Revenue stream detailed view
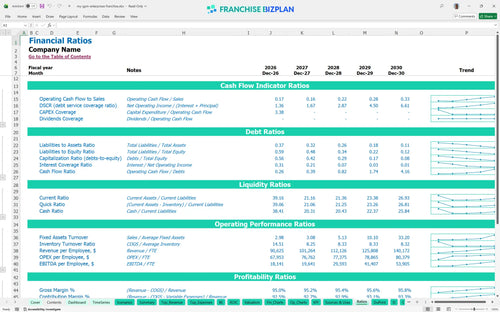
Performance metrics benchmark
We built this franchise unit financial model using our own research to provide a realistic roadmap for prospective owners. Key assumptions like the $300,000 Year 1 membership revenue and the $145,000 initial EBITDA are pre-populated and fully editable to match your specific territory. This tool helps you visualize the 4-year payback period and manage the $400,000 initial investment with confidence.
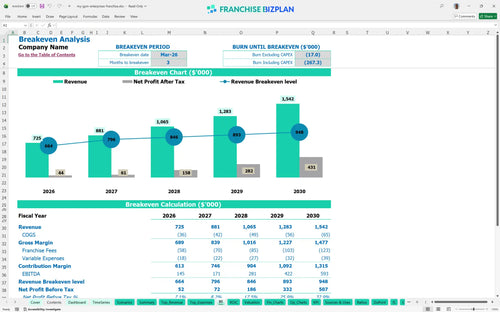
This unit is projected to reach profitability by March 2026, just 3 months after the initial launch. By Year 2, the model forecasts an EBITDA of $171,000 after accounting for all 7% royalties, 1% marketing fees, and the $10,000 monthly rent.
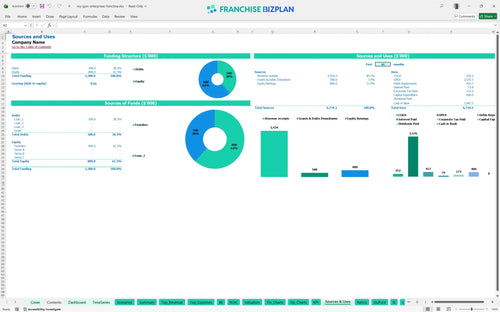
You will need approximately $400,000 in total initial investment to launch this unit in the US, covering the $55,000 franchise fee and significant leasehold improvements. The model also accounts for $100,000 in proprietary fitness equipment and $50,000 for play gym structures to meet brand standards.
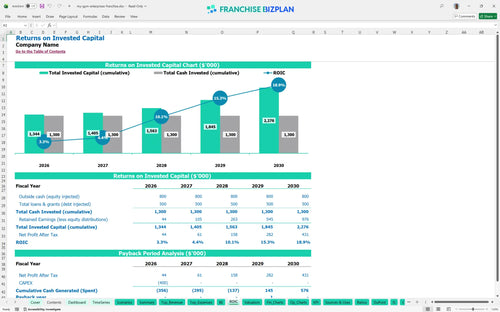
Investors can expect a 4-year payback period and an internal rate of return (IRR) of 3.89% based on the current 5-year growth forecast. While the initial ROE is 1.22, the real value lies in the Year 5 EBITDA of $593,000, which significantly enhances the business valuation for a potential exit.
The unit reaches break-even in just 3 months, requiring enough monthly revenue to cover approximately $14,400 in fixed costs plus variable expenses. The biggest driver for reaching this point is membership volume, as recurring fees provide the steady cash flow needed to offset the $10,000 monthly rent.
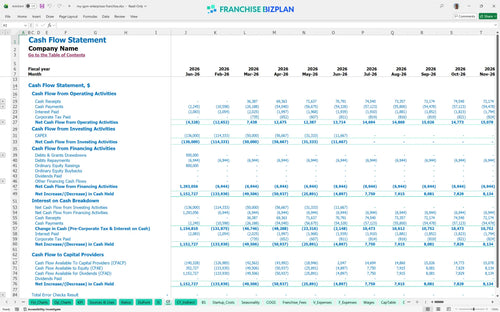
The lowest cash point is projected to be $888,000 in June 2026, assuming you start with sufficient working capital to cover the ramp-up. You defintely want to maintain a 3-month operating buffer to handle the timing gap between payroll for your 4+ instructors and the collection of monthly membership dues.
Moving from the Medium to the High scenario can accelerate your payback period by nearly a year if you can drive birthday party revenue above the $120,000 Year 1 target. Conversely, a Low scenario with 15% fewer memberships would tighten the Year 1 EBITDA margin and require a larger cash reserve to cover the $70,000 director salary.
Finance: update unit break-even and payback model by Friday
This franchise unit financial model is fully customizable in Excel, featuring pre-filled formulas and editable assumptions that allow you to adapt the numbers to your specific territory and local market conditions. You can adjust everything from membership pricing to local labor rates to see how different operating scenarios impact your bottom line.

Long-term planning is essential for multi-unit growth or securing financing, and this model provides a clear 5-year view of revenue, costs, and cash flow. By forecasting out to Year 5, where revenue is projected to hit $1,542,000, you can visualize the transition from a startup phase to a mature, high-margin operation.

This model captures the specific financial obligations of the franchise agreement, including the initial $55,000 franchise fee and ongoing 7% royalty payments. It also accounts for the 1% marketing fund contribution, ensuring you see the true store-level margin after all franchisor obligations are met.

Estimating your total initial investment is the first step to avoiding a cash crunch, and this tool helps you track everything from the $150,000 leasehold improvements to the $100,000 in proprietary equipment. With a calculated break-even date of March 2026, you can determine exactly how much volume you need to cover your $10,000 monthly rent and fixed overhead.

The model incorporates built-in benchmarks for children's fitness centers, allowing you to compare your labor costs and occupancy expenses against typical franchise standards. If your cleaning supplies (starting at 4% of sales) or utilities ($1,800/month) drift too far from these norms, the model helps you identify the leak before it impacts your EBITDA.


Simply purchase and download the financial model template, then access it instantly using Microsoft Excel or Google Sheets. No installation or technical expertise required-just open and start working.

Enter your business-specific numbers, including revenue projections, costs, and investment details. The pre-built formulas will automatically calculate financial insights, saving you time and effort.

Leverage the investor-ready format to confidently showcase your financial projections to banks, franchise representatives, or investors. Impress stakeholders with clear, data-driven insights and professional reports.

Leverage the investor-ready format to confidently present your projections to banks, franchise representatives, or investors.