
All-in-one Dashboard
Core inputs and core outputs


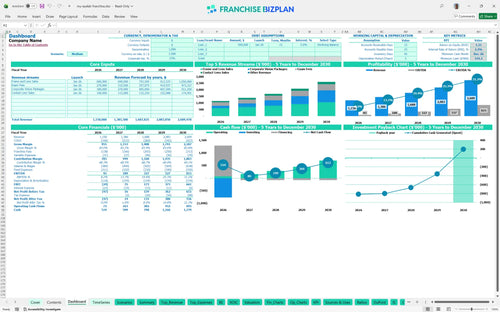
This template provides a complete financial toolkit including a franchise unit performance dashboard template to monitor your store's health.
Core inputs and core outputs
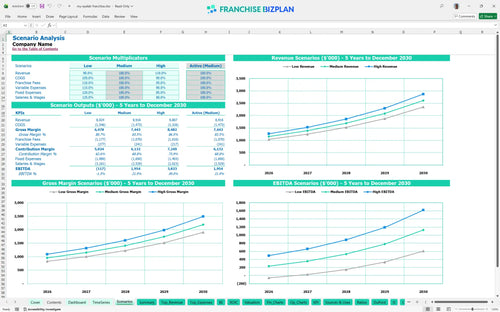
Three scenario analysis
Presentation ready
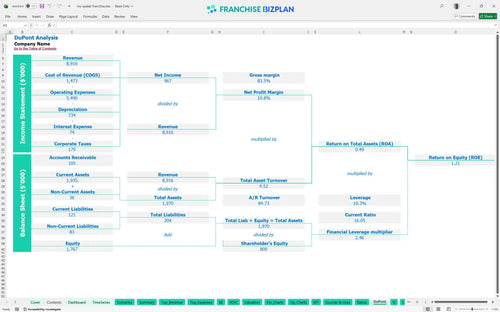
DuPont analysis
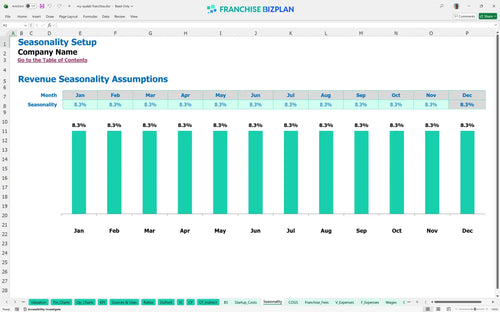
Researched revenue assumptions
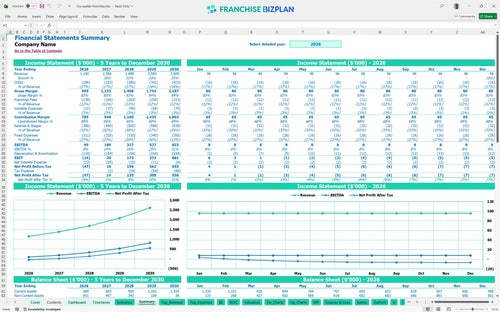
Lender-friendly financial outputs
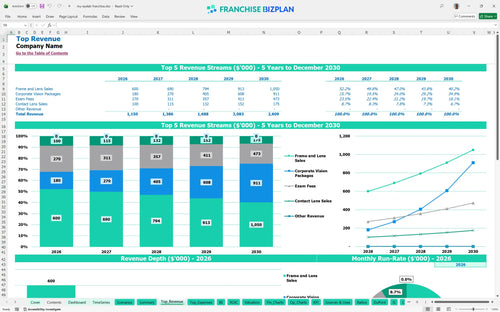
Revenue stream detailed view
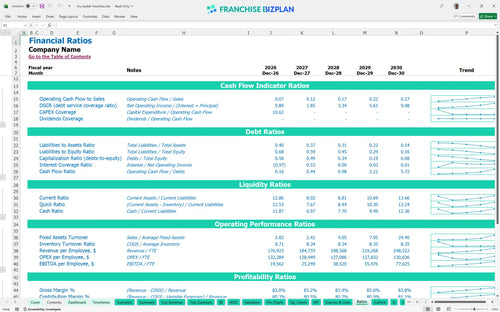
Performance metrics benchmark
We built this franchise unit financial model using our own research into the optical retail sector to ensure accuracy. Key assumptions, such as the $1.15M year-one revenue target and $18,000 monthly rent, are pre-populated but fully editable to fit your specific site. This tool helps you bridge the gap between a brand's potential and your store's actual performance.
Based on the researched data, this unit becomes profitable in its very first year, generating an EBITDA of $95,000. As revenue scales toward the $2.6M mark by year five, the net profit grows substantially alongside it. Profitability is a function of volume and margin control.
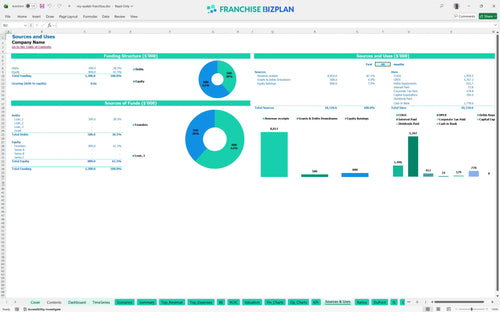
To launch this unit in the US, you need approximately $770,000 in total initial investment. This capital is allocated across the $34,900 franchise fee, $300,000 for leasehold improvements, and $120,000 for telehealth exam equipment. Cash is king when you're building out a $300,000 space.
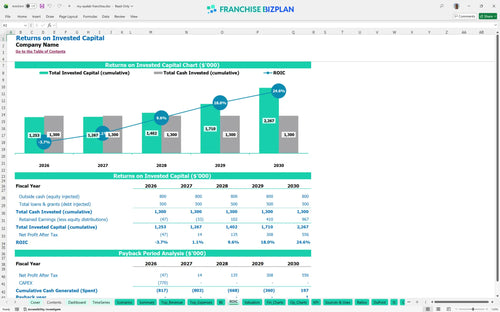
Investors can expect a 5-year payback period with an internal rate of return (IRR) of 2.19%. While the initial years focus on recovering the $770,000 investment, the ROE of 1.21 shows the long-term value of the equity. Patience is required for a 5-year payback.
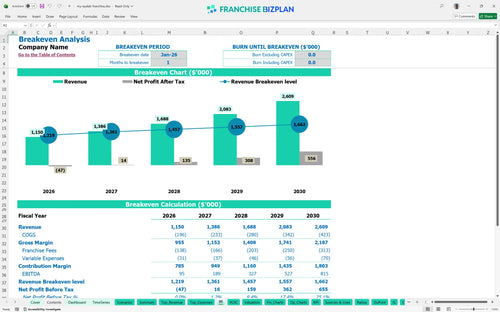
This unit reaches its monthly break-even point in January 2026, just one month after opening. The fast ramp-up is driven by the $400,000 projected in year-one frame and lens sales which cover the high $18,000 monthly rent. Fast break-even depends on day-one traffic.
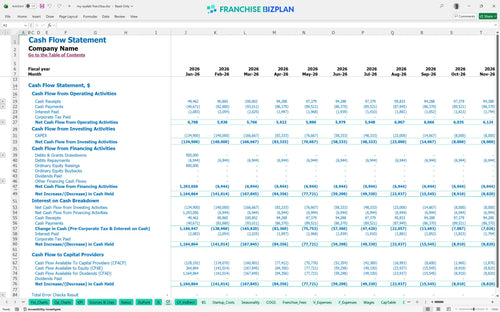
The lowest cash point occurs in December 2026 at $519,000, suggesting you need a significant buffer to handle the 8% marketing fee and high rent. We recommend keeping a healthy reserve to manage the timing gaps in inventory replenishment. A cash buffer is your best insurance policy.
In a franchise business plan financial projections example, moving to a high-growth scenario requires hitting the $607,500 corporate package goal by year five. This shift significantly improves the year-one $95,000 EBITDA and accelerates the overall ROI. Scenarios help you prepare for the worst.
This franchise financial model is built in Excel with completely editable assumptions, allowing you to adjust everything from local rent to specific staffing tiers. You can swap out pre-filled formulas to match your specific territory or local market conditions without breaking the logic. Every formula is open for your local market reality.

Planning for long-term growth is essential in the optical retail space, where equipment and build-out costs are significant. This model provides a clear view of your financial future, projecting a climb from $1.15M in year-one revenue to over $2.6M by year five. Five years is the standard horizon for retail optical success.

Understanding the impact of recurring fees is a core part of retail franchise profitability analysis. The model specifically tracks the 4% royalty and 8% marketing fund contributions to show how they interact with your store-level margins. Royalties are a top-line tax you must plan for.

Launching a new location requires a massive upfront investment in leaseholds and medical equipment, which this model captures in detail. It includes a break-even analysis to help you identify the exact sales volume needed to cover your $18,000 monthly rent and fixed overhead. Knowing your zero-profit number keeps you focused.

The model uses researched industry benchmarks to help you sanity-check your unit economics and operational expenses. With frame and lens COGS (cost of goods sold) starting at 14.5%, you can compare your expected performance against typical retail optical standards. Benchmarks prevent you from being too optimistic.


Simply purchase and download the financial model template, then access it instantly using Microsoft Excel or Google Sheets. No installation or technical expertise required-just open and start working.

Enter your business-specific numbers, including revenue projections, costs, and investment details. The pre-built formulas will automatically calculate financial insights, saving you time and effort.

Leverage the investor-ready format to confidently showcase your financial projections to banks, franchise representatives, or investors. Impress stakeholders with clear, data-driven insights and professional reports.

Leverage the investor-ready format to confidently present your projections to banks, franchise representatives, or investors.