
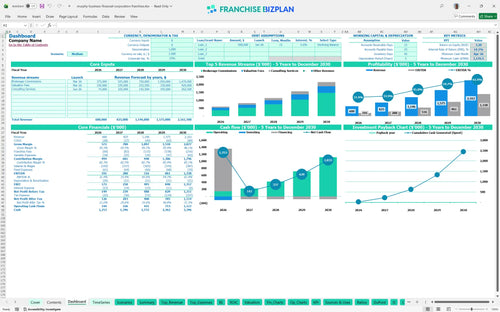
All-in-one Dashboard
Core inputs and core outputs


This franchise investment template provides a comprehensive Excel-based toolkit for forecasting revenue, managing professional service expenses, and calculating long-term ROI for a business brokerage unit.
Core inputs and core outputs
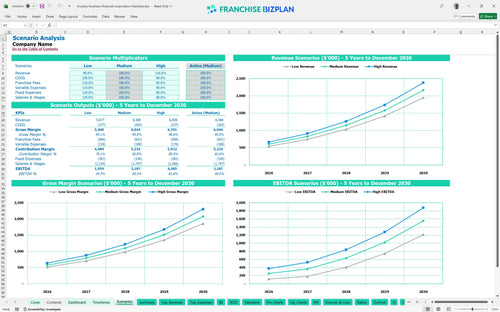
Three scenario analysis
Presentation ready
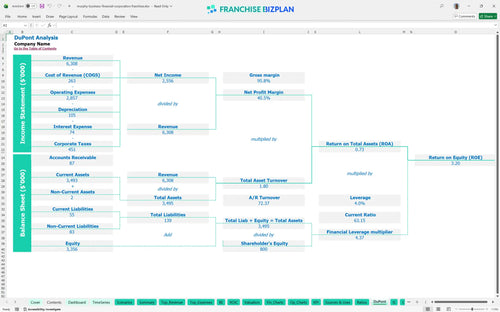
DuPont analysis
Researched revenue assumptions
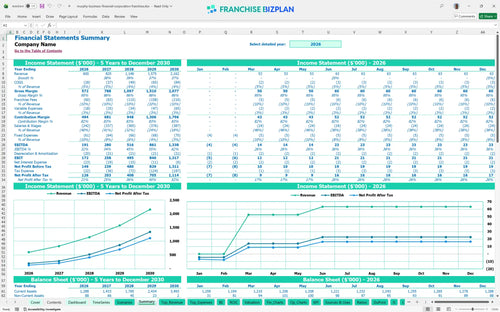
Lender-friendly financial outputs
Revenue stream detailed view
Performance metrics benchmark
We built this franchise financial model using deep industry research to ensure the assumptions reflect the actual day-to-day of a professional services firm. Key drivers like the $105,000 principal salary and 10% royalty are pre-populated but fully editable to match your specific business plan. With a projected Year 1 revenue of $600,000 and a quick 3-month break-even, this model provides a credible foundation for your financial forecasting tools.
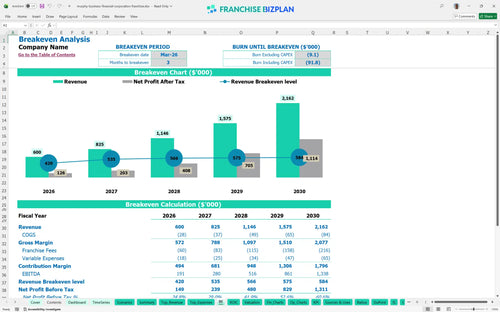
This unit reaches profitability almost immediately, with a break-even date set for March 2026, just three months after launch. By year one, you are looking at an EBITDA of $191,000 after accounting for the 10% royalty and significant professional salaries. Knowing how to calculate franchise profitability is key here, as your margins expand significantly by year three to over $516,000.
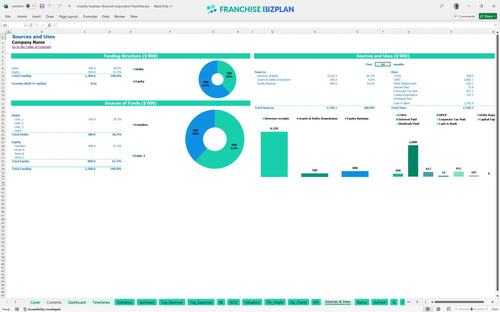
You will need approximately $107,200 in startup capital for business brokerage firm operations to cover the initial build-out and fees. This includes the $47,500 franchise fee and $18,000 for office leasehold improvements to secure a professional space. The model also accounts for $9,500 in IT equipment and $11,000 for furniture to ensure your office meets brand standards from day one.
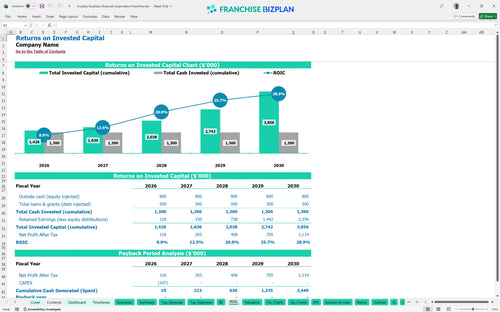
The ROI analysis for professional services franchise owners shows an Internal Rate of Return (IRR) of 14.06% and a Return on Equity of 3.2. While the cash flow is strong, the full payback of your initial investment occurs after year five due to the high initial working capital requirements. Still, the scaling EBITDA suggests a very valuable exit strategy consulting asset by the end of the five-year term.
Your monthly break-even point is hit in month 3, requiring enough revenue to cover roughly $5,210 in fixed monthly overhead plus your significant payroll. The biggest driver for reaching this point is your brokerage commission volume, which defintely needs to hit the $250,000 mark in the first year. Keeping a tight lid on discretionary travel and marketing spend during the first 90 days is vital.
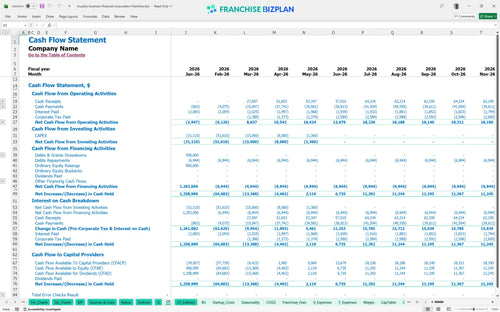
The lowest cash point occurs in April 2026, with a minimum cash requirement of $1,176,000 to maintain operations and the high-level team. You need a substantial buffer because your franchise operational expenses include a $298,000 annual payroll for your core staff. If brokerage closings are delayed by even a few weeks, the working capital pressure rises quickly during the first year.
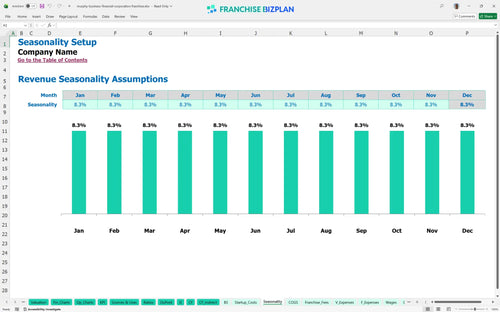
A high-performance scenario, driven by better local marketing execution, can push your Year 1 revenue well past the $600,000 baseline. Conversely, a low scenario where brokerage commissions lag by 20% will delay your break-even and significantly increase your peak cash need. This financial performance representation for franchises helps you see that even a small dip in valuation fees can squeeze your year-one margin.
This franchise financial model is built in Excel to give you total control over your projections. It includes pre-filled formulas and editable assumptions for business appraisal services and brokerage commissions, making it easy to adjust for your specific territory and local market conditions. You can swap out the default values for your own data to see how different commission splits or service fees impact your bottom line.

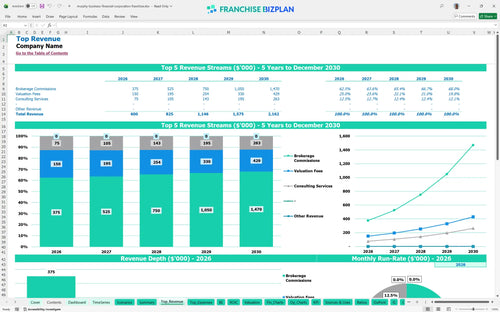
Planning for the long haul is easier with a detailed 5-year outlook that tracks revenue, costs, and cash flow. This business valuation franchise financial projections tool maps out your path from a $600,000 first year to a projected $2.16 million in year five. It provides a clear view of how your profit margins should evolve as you scale your brokerage and consulting volume over time.

Managing your obligations to the franchisor is built directly into the cash flow logic. The model calculates the 10% royalty fee automatically against your gross revenue, ensuring you always know the real operating expenses for business intermediary franchise units. By tracking these ongoing costs alongside the initial $47,500 franchise fee, you get a transparent look at your net store-level margin.

Estimating your business brokerage franchise startup costs is the first step toward a successful launch. This template outlines the $107,200 in initial capital needed for items like office leaseholds, IT equipment, and training. It also calculates your break-even sales level, showing you exactly how many valuations or brokerage deals you need to close each month to cover your $3,200 monthly rent and staff salaries.

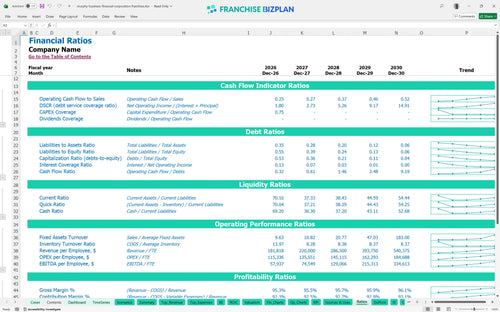
We have integrated industry-specific benchmarks to help you perform a realistic franchise profitability analysis. You can compare your projected labor costs, which include a $105,000 Principal Broker salary, against typical professional service standards. This allows you to sanity-check your overhead and ensure your $3,200 monthly rent and other fixed costs stay within a healthy percentage of your total revenue.


Simply purchase and download the financial model template, then access it instantly using Microsoft Excel or Google Sheets. No installation or technical expertise required-just open and start working.

Enter your business-specific numbers, including revenue projections, costs, and investment details. The pre-built formulas will automatically calculate financial insights, saving you time and effort.

Leverage the investor-ready format to confidently showcase your financial projections to banks, franchise representatives, or investors. Impress stakeholders with clear, data-driven insights and professional reports.

Leverage the investor-ready format to confidently present your projections to banks, franchise representatives, or investors.