
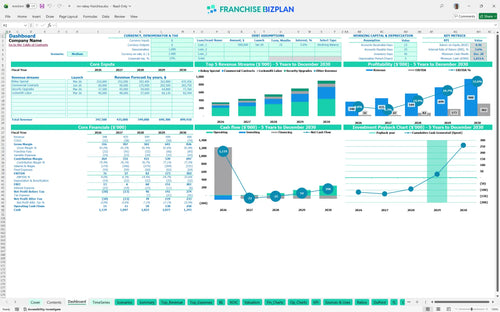
All-in-one Dashboard
Core inputs and core outputs


This franchise unit financial model template provides a data-driven framework to forecast revenue, manage locksmith-specific expenses, and calculate the total return on your investment.
Core inputs and core outputs
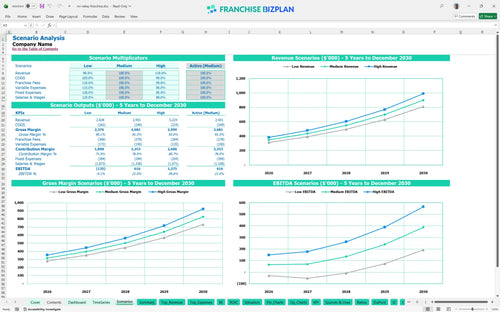
Three scenario analysis
Presentation ready
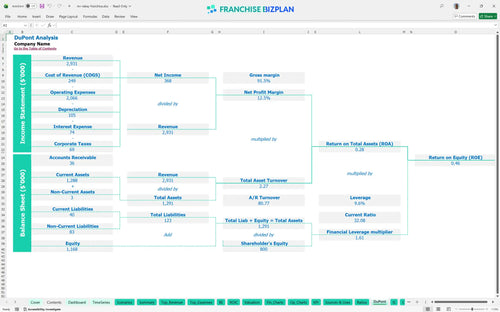
DuPont analysis
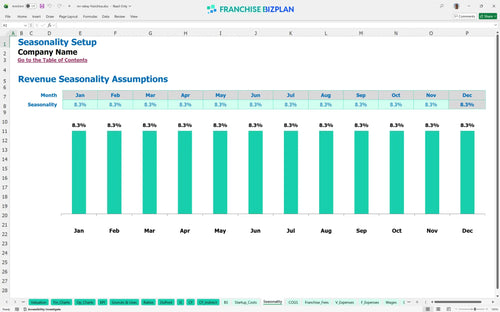
Researched revenue assumptions
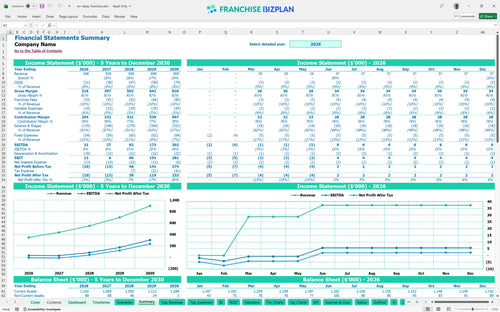
Lender-friendly financial outputs
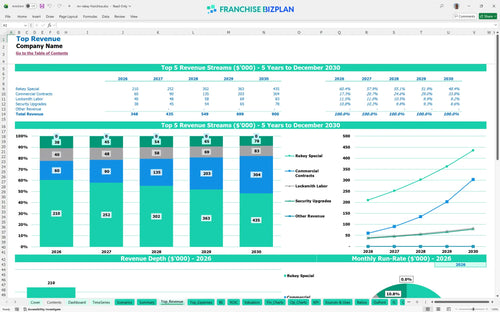
Revenue stream detailed view
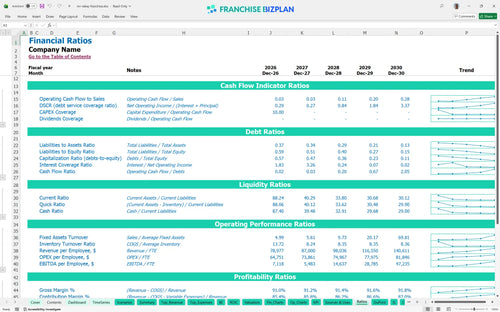
Performance metrics benchmark
We built this franchise unit financial model using detailed research on mobile locksmith operations to ensure your projections are grounded in reality. The model comes pre-populated with a $30,000 franchise fee, 7.5% royalties, and a year-one revenue target of $348,000, all of which you can easily adjust as your local market demand shifts.
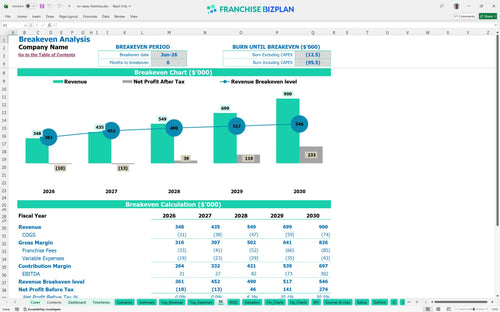
This locksmith franchise unit is projected to reach its break-even point in June 2026, just six months after launching. You will defintely see EBITDA grow from $31,000 in the first year to over $302,000 by year five as your commercial contracts and rekey specials scale.
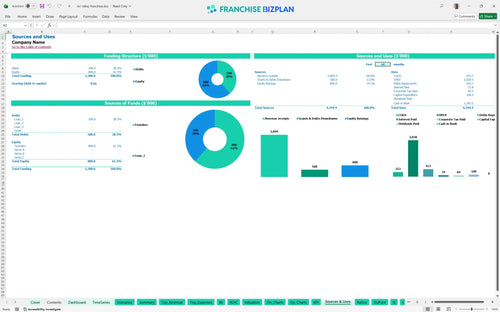
You will need approximately $108,000 in initial capital to cover the franchise fee, equipment, and two branded service vehicles. The primary uses of funds include the $30,000 initial fee and $53,000 for the mobile fleet required to service the local territory.
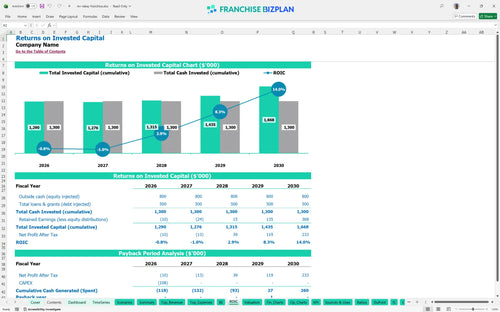
Investors can expect a full payback on their initial investment within 4 years of operation. The model shows an Internal Rate of Return (IRR) of 3.59% and a Return on Equity (ROE) of 0.46 based on the five-year growth trajectory and steady margin improvements.
The unit reaches monthly break-even in month 6, driven primarily by the volume of the signature rekey special and locksmith labor. Your ability to cover fixed costs like the $2,200 fleet lease and $950 vehicle insurance depends on maintaining technician productivity and a steady job flow.
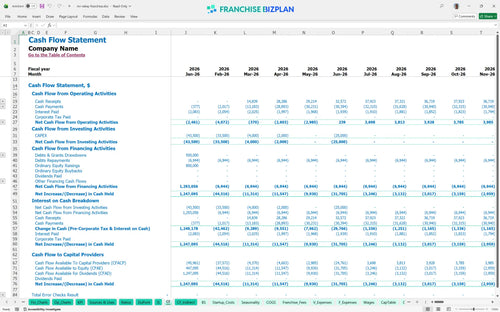
The lowest cash point occurs in December 2028, suggesting you should maintain a healthy working capital reserve to handle fleet maintenance and technician hiring. While the model shows a minimum cash position of $1,023,000, you should monitor the timing of your second vehicle purchase to avoid unnecessary liquidity crunches.
Moving from a medium to a high-growth scenario can push your year-five revenue toward the $900,000 mark and significantly accelerate your ROI. The model allows you to test how a 10% shift in technician wages or a drop in commercial contract volume affects your peak cash needs and long-term margins.
Finance: update unit break-even and payback model by Friday.
This franchise unit financial model is a fully editable Excel tool that allows you to swap out every assumption to match your specific territory. You can adjust the pre-filled formulas for local labor rates, vehicle lease terms, and service volume to see how they impact your bottom line in real-time.

You can map out your long-term growth with detailed 5-year projections covering everything from initial launch to a mature multi-vehicle operation. The model tracks revenue scaling from $348,000 in year one up to $900,000 by year five, providing a clear view of your expected cash flow and balance sheet health.

This tool automatically calculates your ongoing financial obligations to the franchisor, including the 7.5% royalty and 2% marketing fund fees. By baking these costs into your monthly projections, you can see exactly how much cash remains for local operations after paying for brand support and systems.

You can pinpoint your exact break-even point and total initial investment by analyzing the relationship between fixed costs and variable service margins. The model helps you visualize the specific sales volume needed to cover your fleet leases, insurance, and technician wages during the critical ramp-up phase.

The model includes researched benchmarks for mobile service businesses to help you sanity-check your technician productivity and fuel costs. Comparing your projected 7.2% hardware cost or 2% fuel expense against industry standards ensures your business plan remains grounded in operational reality.


Simply purchase and download the financial model template, then access it instantly using Microsoft Excel or Google Sheets. No installation or technical expertise required-just open and start working.

Enter your business-specific numbers, including revenue projections, costs, and investment details. The pre-built formulas will automatically calculate financial insights, saving you time and effort.

Leverage the investor-ready format to confidently showcase your financial projections to banks, franchise representatives, or investors. Impress stakeholders with clear, data-driven insights and professional reports.

Leverage the investor-ready format to confidently present your projections to banks, franchise representatives, or investors.