
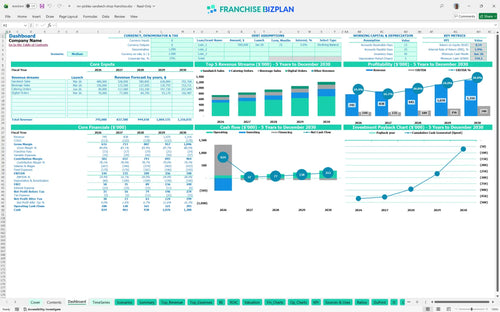
All-in-one Dashboard
Core inputs and core outputs


This fast casual franchise business plan template provides a ready-to-use framework for forecasting the performance and restaurant unit economics of a specialty sandwich shop.
Core inputs and core outputs
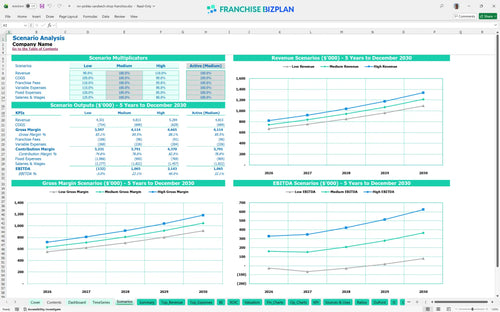
Three scenario analysis
Presentation ready
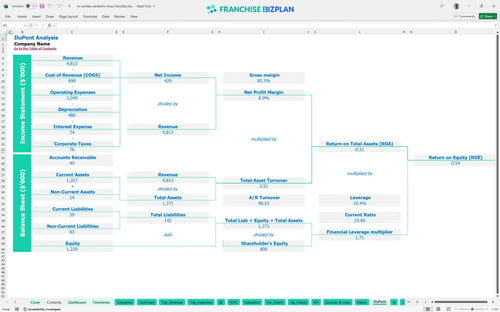
DuPont analysis
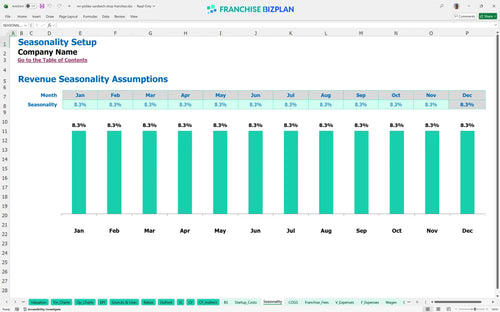
Researched revenue assumptions
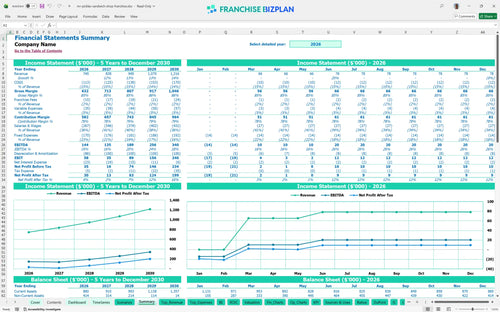
Lender-friendly financial outputs
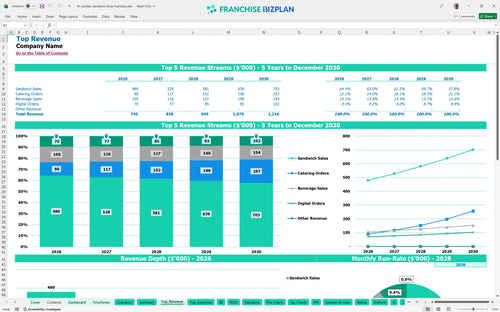
Revenue stream detailed view
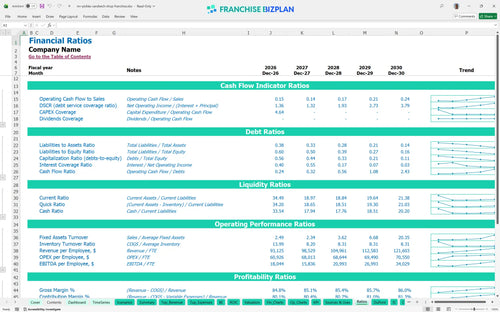
Performance metrics benchmark
We built this franchise unit financial model using our own research to help you understand how to calculate startup costs for a sandwich shop franchise. Key assumptions, including revenue streams, operating expenses, and the $35,000 franchise fee, are pre-populated with researched data specific to Mr. Pickle's Sandwich Shop Franchise franchise unit and are fully editable. By year five, EBITDA is projected to reach $340,000.
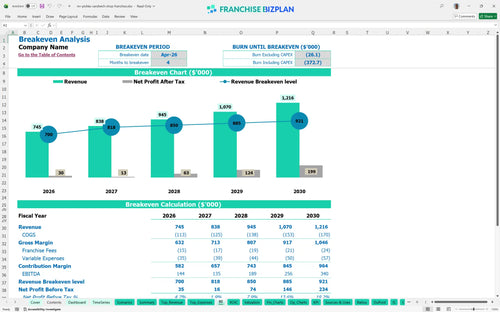
The unit reaches monthly profitability in April 2026, just four months after the initial launch. This assumes you hit the $745,000 year-one revenue target while managing food ingredients at 12.8% and a $9,000 monthly rent. Net profit grows steadily as revenue scales toward $1.2 million by year five.
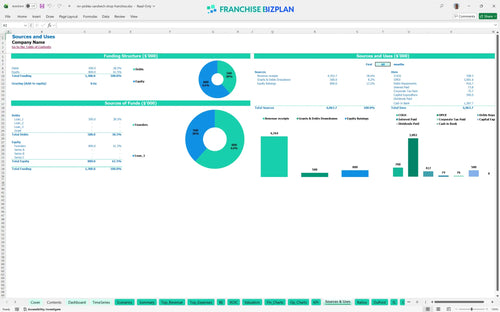
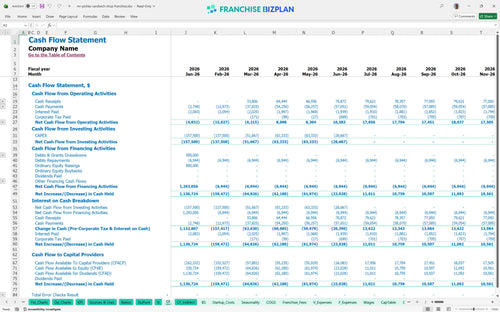
To launch this franchise unit in the US, you need approximately $500,000 in startup capital plus a significant cash buffer. This includes the $35,000 franchise fee, $220,000 for leasehold improvements, and $110,000 for kitchen equipment. The model shows a minimum cash requirement of $759,000 to handle the ramp-up phase through June 2026.
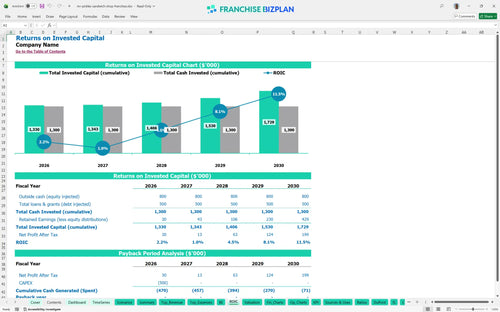
The franchise investment return calculator for food businesses shows an Internal Rate of Return (IRR) of 1.85% and a Return on Equity (ROE) of 0.54. While the unit is profitable quickly, the full payback of the initial investment extends past the five-year mark. This is common in premium locations where high build-out costs trade off against long-term asset value.
The monthly break-even point occurs in April 2026, driven primarily by sandwich volume and the $9,000 monthly rent. Because food and packaging costs are relatively low at roughly 15.2% combined, your ability to cover fixed costs depends mostly on maintaining high daily traffic. The biggest driver here is sandwich volume.
The lowest cash balance occurs in June 2026 at $759,000, requiring a deep reservoir of working capital during the first six months. If opening takes 90+ days longer than planned, working capital pressure rises significantly. It is defintely worth keeping a 10% contingency fund for those first few months of payroll.
In a high-revenue scenario, reaching $1.2 million in sales by year five significantly improves your long-term margins. However, a low-revenue scenario where catering orders fail to ramp up could push your break-even date back and increase the peak cash need. The model allows you to toggle these cases to see how traffic impacts your salary coverage.
This sandwich shop franchise financial model lives in Excel, so you can tweak every variable to fit your specific territory. Whether you are adjusting the price of a signature sandwich or shifting labor hours for the lunch rush, the pre-filled formulas update instantly. It is a flexible tool designed for real-world operators who need to see how a 5% bump in food costs hits the bottom line. Every 1-point margin leak matters fast in a single-unit model.

You need to see past the grand opening to understand if this investment actually scales over time. This franchise unit financial projection template provides a full 5-year outlook, showing revenue climbing from $745,000 in year one to over $1.2 million by year five. It maps out the full P&L statement, cash flow, and balance sheet so you can spot potential capital gaps before they happen. Planning five years out is the only way to see the true trajectory of your equity.

Franchise agreements come with specific math that can eat your margin if you are not careful. This tool tracks the $35,000 initial fee and the ongoing 2% marketing fund contribution automatically to help with franchise business financial feasibility study template creation. While the current data shows a 0% royalty, the model allows you to plug in any percentage to see how it impacts your store-level EBITDA. Knowing your fixed brand obligations helps you manage the local overhead you actually control.

Opening a new shop requires significant upfront capital, from $220,000 in leasehold improvements to $110,000 for kitchen gear. This restaurant franchise startup cost calculator aggregates these costs to show your total all-in investment before the first sandwich is sold. It also identifies your break-even point, which is currently estimated at month 4. If your build-out goes over budget, you can instantly see how much more volume you need to cover the nut.

Do not guess if your $9,000 monthly rent is too high for your projected sales in a high traffic location. The model includes built-in benchmarks to help you sanity-check your food costs, which start at 12.8% in this scenario. If your labor or occupancy costs drift too far from the norm, the model flags it so you can adjust your strategy. It is basically a reality check for your business plan.


Simply purchase and download the financial model template, then access it instantly using Microsoft Excel or Google Sheets. No installation or technical expertise required-just open and start working.

Enter your business-specific numbers, including revenue projections, costs, and investment details. The pre-built formulas will automatically calculate financial insights, saving you time and effort.

Leverage the investor-ready format to confidently showcase your financial projections to banks, franchise representatives, or investors. Impress stakeholders with clear, data-driven insights and professional reports.

Leverage the investor-ready format to confidently present your projections to banks, franchise representatives, or investors.