
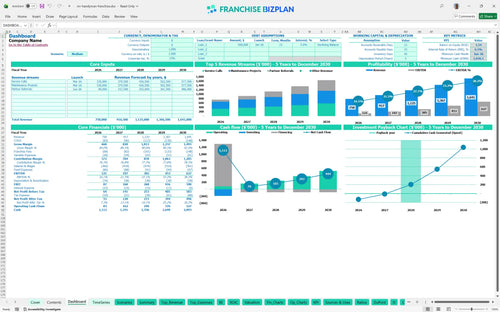
All-in-one Dashboard
Core inputs and core outputs


The capital expenditure planning section of this Excel template for franchise unit financial forecasting covers everything from your initial franchise fee to the specific tools and branded van wraps needed to launch.
Core inputs and core outputs
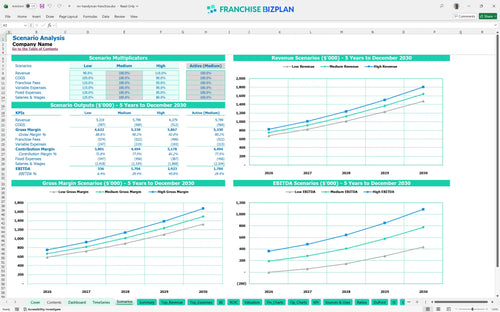
Three scenario analysis
Presentation ready
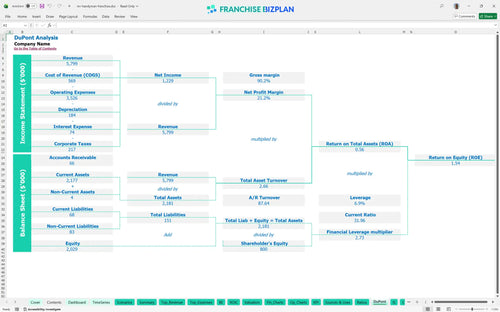
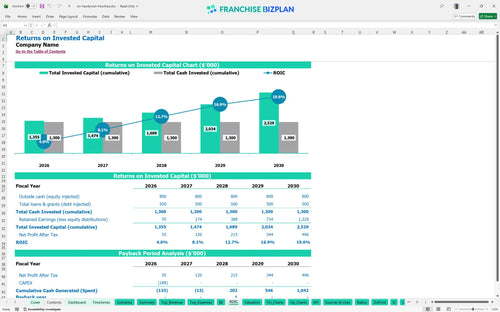
DuPont analysis
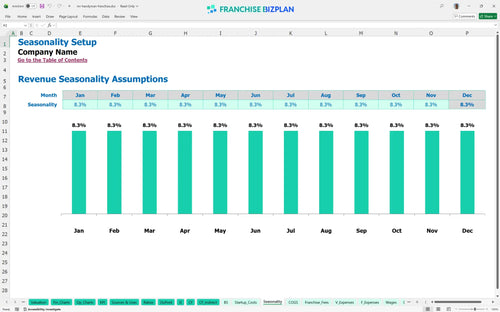
Researched revenue assumptions
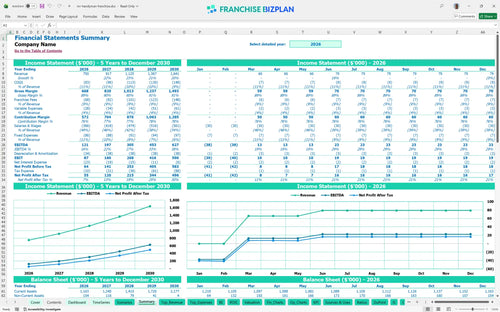
Lender-friendly financial outputs
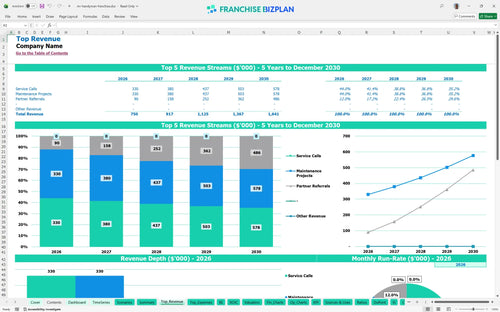
Revenue stream detailed view
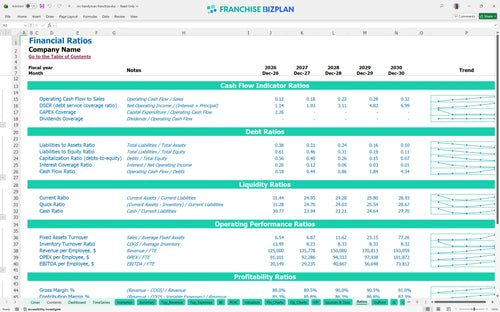
Performance metrics benchmark
We built this franchise unit financial model using our own research into the home maintenance sector. Key assumptions like revenue streams, 7% royalties, and $187,500 in startup CAPEX are pre-populated for a Mr. Handyman Franchise unit and are fully editable. This tool is essential for evaluating profitability of a home maintenance franchise and serves as a financial model for handyman business opportunities. Use it to run a complete franchise unit profitability analysis before signing your agreement.
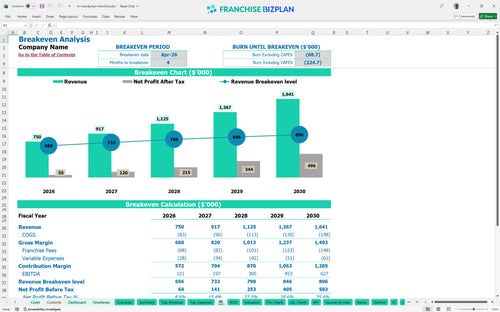
Based on the numbers, this unit hits its stride early, reaching break-even by April 2026, just four months after launching. By year two, EBITDA jumps to $197,000 as you scale maintenance projects and partner referrals. Still, your net profit depends on keeping technician billable hours high and material waste low.
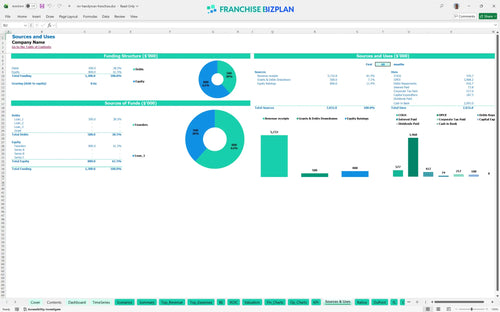
You'll need roughly $187,500 in total capital to get this off the ground, covering the $65,000 franchise fee and a $70,000 fleet investment. We also factored in $15,000 for tools and a $6,000 initial inventory buffer to keep the vans stocked from day one. You can't fix what you can't fund.
The franchise investment analysis for service businesses shows a 3-year payback period and an IRR of 6.49%. While the return on equity sits at 1.54, the real value is in the long-term cash flow, with EBITDA climbing toward $627,000 by year five as the brand matures. This ROI analysis assumes you maintain a 38% EBITDA margin by year five.
Estimating labor costs for service-based franchises is the hardest part of the break-even analysis. You need to hit break-even by month four to stay on track. The biggest driver here is technician productivity; with fixed costs like $3,800 for rent and $15,000+ in monthly salaries, your crew needs to be in the field billing hours. Throughput is the only metric that pays the rent.
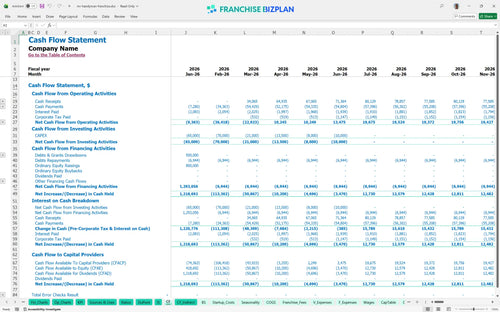
Managing fleet operational expenses in a franchise model requires a buffer, especially when fuel and vehicle costs run 2.5% of sales. Your lowest cash point defintely hits in June 2026, with a minimum cash balance of $1,036,000. If technician ramp-up takes longer than four months, your runway gets short fast, so watch the pennies.
Revenue forecasting for residential repair franchises shows that hitting the $1.6 million high-case scenario by year five depends on technician productivity. In a low-revenue scenario, your 3-year payback might slip, but the 7% royalty remains a fixed percentage of whatever you bring in. Plan for the worst but execute for the best.
Finance: update unit break-even and payback model by Friday.
This franchise financial model template is built in Excel, letting you tweak every variable from technician pay to van fuel costs. Since every territory has different labor rates and rent prices, these editable assumptions ensure your projections actually reflect your local market. Every billable hour counts when you're scaling a service fleet.

Planning for a single territory or a multi-unit rollout requires a long-term view of cash flow and profitability. This franchise business plan template provides a 5-year outlook, mapping out how revenue scales from $750,000 in year one to over $1.6 million by year five as you add more service technicians. Use these franchise unit budget and cash flow projections to secure financing or plan your expansion.

Royalties and brand funds are the franchise tax that can eat your margin if you aren't careful. We've baked in the 7% royalty and 2% marketing fee so you can see exactly how much goes to the franchisor every month. It's the best way to track your true operating expenses and store-level EBITDA after all franchise royalty fees are paid.

Knowing how to calculate startup costs for a home repair franchise is the difference between a smooth launch and a cash crunch. This handyman franchise startup costs tool aggregates your $65,000 franchise fee, van purchases, and equipment to show you the total nut. Plus, the break-even analysis tells you exactly when the doors stay open on their own.

We use real-world data to set guardrails for your home service franchise financial projections. If your material costs are way higher than the 10% benchmark or your rent exceeds the local average, the model flags it. These financial planning tools for new franchise owners help you sanity-check your unit economics against the residential repair space.


Simply purchase and download the financial model template, then access it instantly using Microsoft Excel or Google Sheets. No installation or technical expertise required-just open and start working.

Enter your business-specific numbers, including revenue projections, costs, and investment details. The pre-built formulas will automatically calculate financial insights, saving you time and effort.

Leverage the investor-ready format to confidently showcase your financial projections to banks, franchise representatives, or investors. Impress stakeholders with clear, data-driven insights and professional reports.

Leverage the investor-ready format to confidently present your projections to banks, franchise representatives, or investors.