


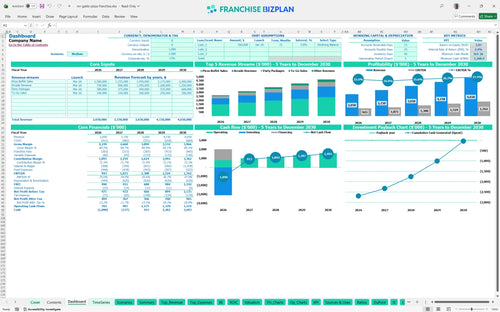
All-in-one Dashboard
Core inputs and core outputs



This comprehensive Excel template provides a detailed roadmap for managing the high-volume revenue streams and significant capital requirements of a pizza buffet and entertainment franchise unit.
Core inputs and core outputs
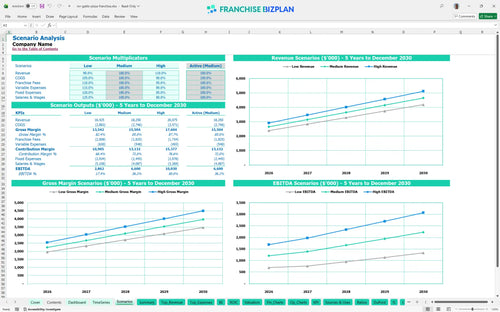
Three scenario analysis
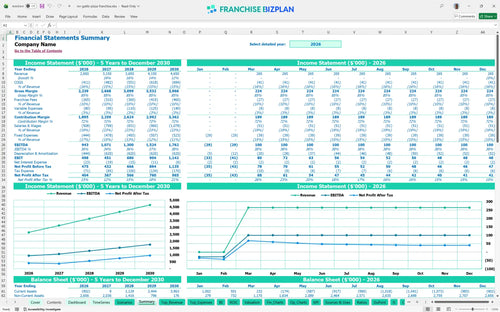
Presentation ready
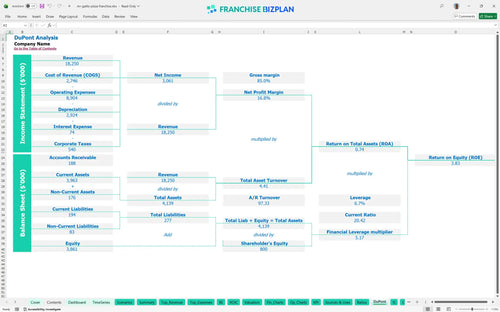
DuPont analysis
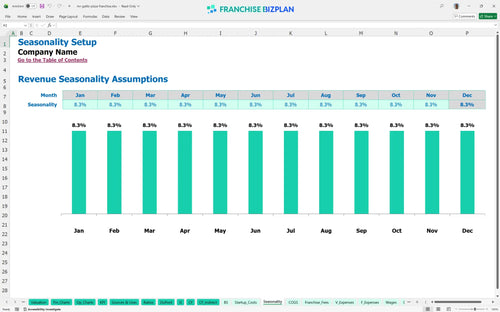
Researched revenue assumptions
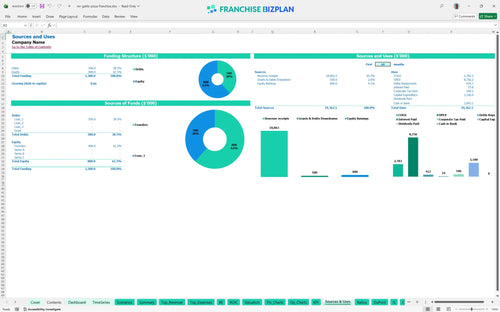
Lender-friendly financial outputs
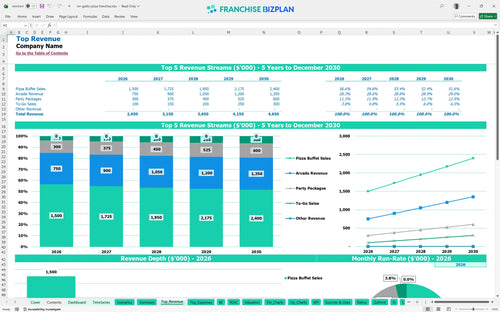
Revenue stream detailed view
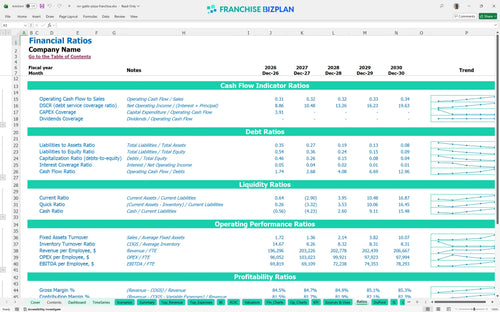
Performance metrics benchmark
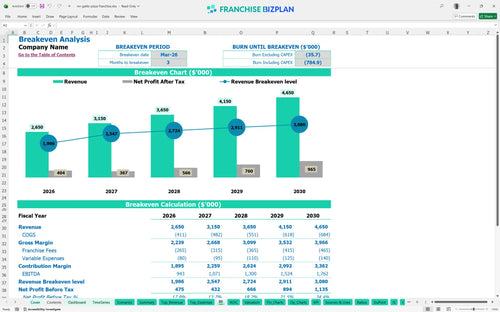
The unit is projected to reach monthly break-even by March 2026, just three months after launching. While year-one EBITDA is a strong $943,000, the high initial CAPEX (capital expenditure) means you will defintely need to focus on consistent traffic to maintain this path. Profitability scales significantly by year five, reaching an estimated $1.76 million as revenue grows and food costs stabilize.
You will need approximately $3.1 million to get this unit off the ground, with the largest portions allocated to leasehold improvements and arcade gaming gear. This total includes the $50,000 franchise fee, $450,000 for kitchen equipment, and a $100,000 buffer for setup deposits. Most of these funds are deployed in the first six months of 2026 during the build-out and equipment installation phase.
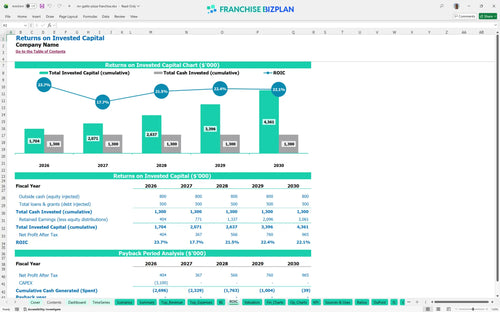
The model shows an Internal Rate of Return (IRR) of 2.41% and a Return on Equity (ROE) of 3.83% over the first five years. Because of the $3.1 million initial investment, the full payback of your original capital occurs after the five-year mark. This is a long-term play where value is built through consistent cash flow and the eventual resale value of a high-volume multi-revenue location.
Break-even occurs in March 2026, assuming you hit your initial monthly revenue targets from the buffet and arcade streams. The primary driver for reaching this point is volume; with $25,000 in fixed rent and a large staff, you need high throughput to cover the 10% combined royalty and marketing burden. Managing the 13% food cost early on is critical to protecting your contribution margin during the ramp-up.
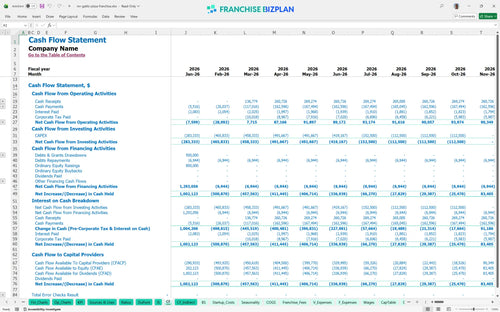
The lowest cash point hits in October 2026 at negative $1.26 million, reflecting the gap between heavy upfront construction costs and the early months of operation. You need to ensure your financing covers this valley to avoid a liquidity crunch before the unit matures. We recommend a cash buffer to handle potential delays in leasehold improvements or slower-than-expected arcade revenue growth.
A high-performance scenario, driven by strong party package sales and arcade demand, can push year-one revenue well beyond the $2.65 million base. Conversely, a low-revenue scenario where arcade maintenance costs spike or buffet traffic lags will delay your break-even and deepen the peak cash need. The model allows you to stress-test these variables to see how a 10% shift in labor or food costs impacts your year-one margin.
To move forward, you must validate these projections against your specific site and local labor market rates. Use the model to run a sensitivity analysis on the $1.2 million leasehold estimate, as construction variances are the biggest risk to your initial ROI. Once your local costs are plugged in, you can present a data-backed case to lenders or partners for the necessary $3.1 million in startup capital.
Finance: update unit break-even and payback model by Friday
This pizza franchise business plan tool is built in Excel with fully editable formulas, allowing you to swap out assumptions for your specific territory or local market costs. You can adjust everything from the $25,000 monthly rent to the number of arcade attendants to see how small changes impact your bottom line. It's a flexible framework designed to handle the multi-revenue complexity of a buffet and entertainment center without the headache of building a spreadsheet from scratch.

Mapping out your growth is vital when you are scaling from a $2.65 million year-one start to a projected $4.65 million by year five. This franchise financial projection spreadsheet tracks long-term profitability, showing how EBITDA (earnings before interest, taxes, depreciation, and amortization) scales as you refine your food costs and arcade maintenance. It provides a clear look at your five-year trajectory, helping you plan for future equipment upgrades or additional unit expansion.

Operating under a brand means managing constant outflows like the 8% royalty and 2% marketing fund contribution that hit your top line every month. This model calculates these fees automatically based on your pizza buffet, arcade, and party sales, so you know exactly what remains for store-level operations. It ensures you account for the $50,000 initial franchise fee and ongoing brand obligations right from the start.

With a heavy initial investment including $1.2 million in leasehold improvements and $900,000 in arcade equipment, knowing your break-even point is non-negotiable. This model helps you visualize the $3.1 million total startup budget and identifies the exact month you stop burning cash and start generating profit. It breaks down fixed costs like the $25,000 rent against variable food and packaging expenses to find your safety margin.

We have integrated food service franchise unit economics benchmarks, such as food ingredients starting at 13% of sales, to help you verify if your projections are realistic. You can compare your $85,000 general manager salary and other labor inputs against industry standards to ensure your margins stay healthy. These benchmarks act as a sanity check for your restaurant franchise startup costs and ongoing operating expenses.


Simply purchase and download the financial model template, then access it instantly using Microsoft Excel or Google Sheets. No installation or technical expertise required-just open and start working.

Enter your business-specific numbers, including revenue projections, costs, and investment details. The pre-built formulas will automatically calculate financial insights, saving you time and effort.

Leverage the investor-ready format to confidently showcase your financial projections to banks, franchise representatives, or investors. Impress stakeholders with clear, data-driven insights and professional reports.

Leverage the investor-ready format to confidently present your projections to banks, franchise representatives, or investors.