
All-in-one Dashboard
Core inputs and core outputs


This Excel template for franchise unit financial forecasting includes dynamic P&L statements, cash flow tracking, and automated schedules for appliance repair franchise startup costs.
Core inputs and core outputs
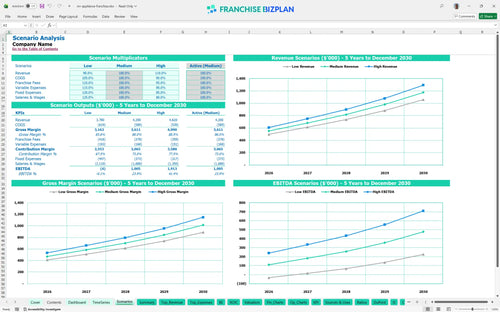
Three scenario analysis
Presentation ready
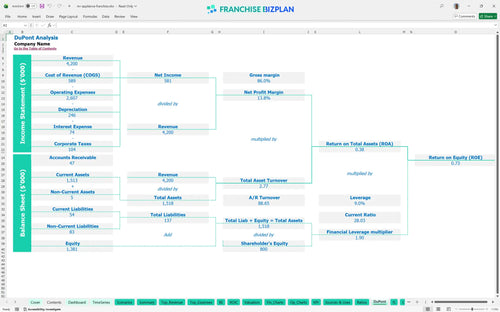
DuPont analysis
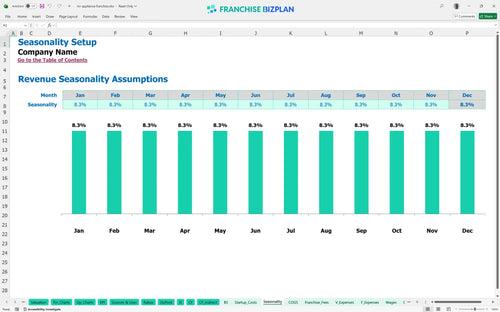
Researched revenue assumptions
Lender-friendly financial outputs
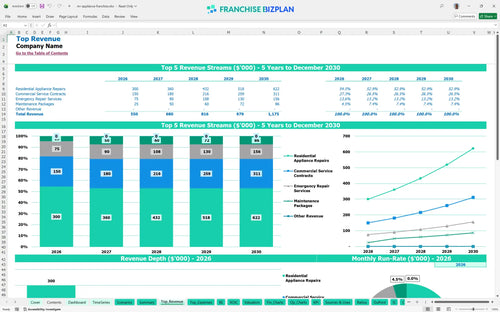
Revenue stream detailed view
Performance metrics benchmark
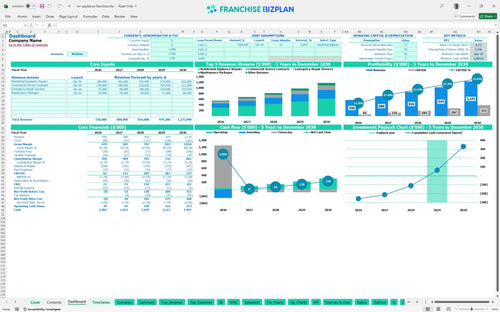
We built this franchise unit financial model using detailed research on home service operations and appliance repair franchise revenue and profit potential. Key assumptions like the $550,000 year-one revenue and 7% royalty are pre-populated and fully editable to fit your specific market. This model helps you understand how to create a P&L statement for a service franchise without starting from scratch.
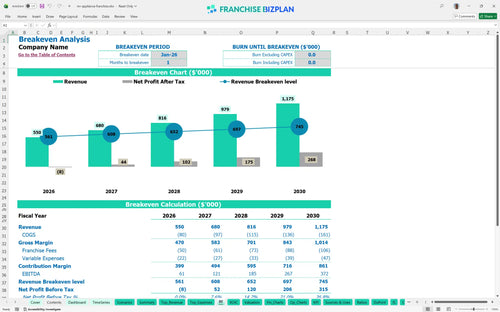
You can expect the unit to reach operational break-even by January 2026, just one month after launch. With EBITDA growing from $61,000 in year one to $372,000 by year five, the trajectory is defintely strong if you manage technician bonuses and parts costs effectively.
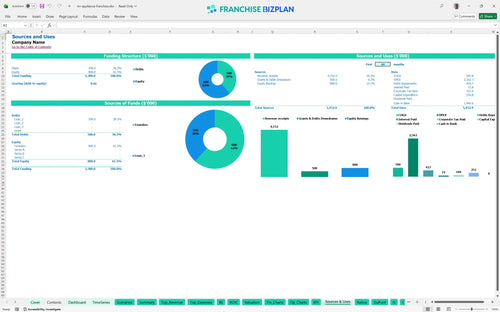
Knowing how to calculate startup costs for an appliance repair franchise is vital, as you will need roughly $250,750 in total initial capital. This covers the $63,750 franchise fee, $80,000 for service vehicles, and $30,000 for your office and warehouse fitout as part of your financial model template for home service franchise.
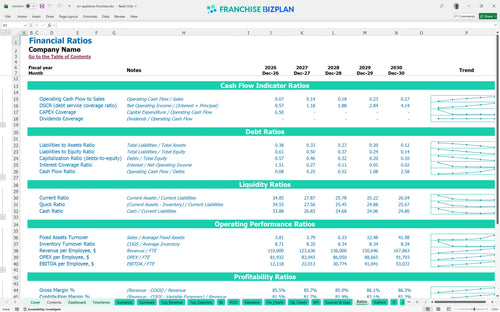
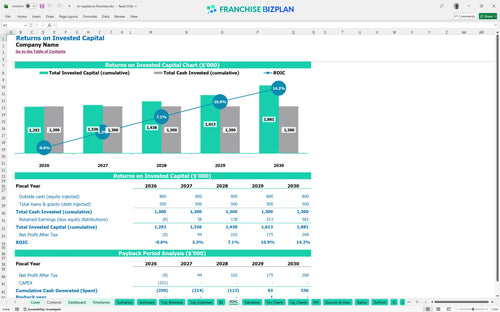
The model shows a 3.48% IRR and a 4-year payback period on your initial investment. Analyzing franchise investment return on investment is critical, as your ROE sits at 0.73 by the end of the projection period, reflecting the steady growth of the service model.
Your monthly break-even is reached in January 2026 because the model assumes a quick ramp-up in residential repairs. The biggest driver for this is technician productivity, as labor for the GM, Lead Tech, and Dispatcher represents your largest fixed burden before scaling the fleet.
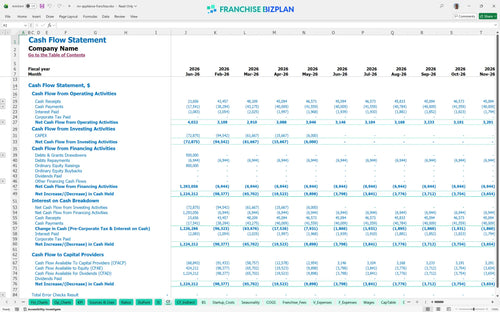
The lowest cash point occurs in January 2027, with a minimum cash balance of $1,003,000 including initial funding. You need to maintain a buffer to handle the timing gap between technician pay cycles and commercial contract payments while managing your operating expenses spreadsheet.
Estimating fleet operational costs for appliance repair business varies between low and high scenarios. A high-performance case improves your year-one $61,000 EBITDA by increasing maintenance package sales and keeping parts costs at the lower 12.2% end of the scale.
Finance: update unit break-even and payback model by Friday.
This franchise financial model template is a flexible Excel tool that lets you swap out default assumptions for your specific territory. You can adjust the $2,500 monthly warehouse rent or the 13% parts cost to see how local price shifts impact your bottom line, making it one of the best financial planning tools for new franchise owners.

Map out your five-year path from a $550,000 year-one start to a $1,175,000 mature operation using this franchise business plan Excel. This service franchise profitability analysis tracks how adding service technicians each year changes your scale and helps you perform a detailed financial feasibility study for residential service franchise units.

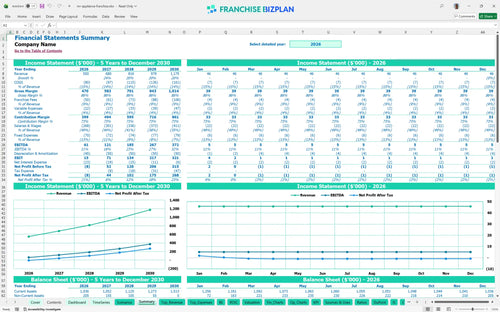
The model automatically calculates the 7% royalty and 2% marketing fund contribution against your monthly gross sales. Seeing these franchise royalty fees side-by-side with your $1,200 vehicle lease payments helps you manage the total cost of brand compliance within your franchise fee and royalty cost analysis spreadsheet.

Use this tool to plan your initial investment, covering the $63,750 franchise fee and $80,000 for service vehicles. A clear break-even analysis shows exactly how many residential appliance repairs you need each month to cover fixed costs and reach the January 2026 break-even date.

We have pre-loaded unit economics data like the 13% parts-to-revenue ratio and 1.8% credit card processing fees. These benchmarks let you sanity-check your appliance repair business financial projections against industry standards for residential service brands while using an operating expenses spreadsheet.


Simply purchase and download the financial model template, then access it instantly using Microsoft Excel or Google Sheets. No installation or technical expertise required-just open and start working.

Enter your business-specific numbers, including revenue projections, costs, and investment details. The pre-built formulas will automatically calculate financial insights, saving you time and effort.

Leverage the investor-ready format to confidently showcase your financial projections to banks, franchise representatives, or investors. Impress stakeholders with clear, data-driven insights and professional reports.

Leverage the investor-ready format to confidently present your projections to banks, franchise representatives, or investors.