
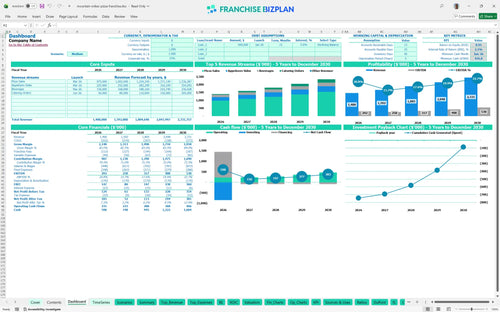
All-in-one Dashboard
Core inputs and core outputs


This financial model provides a complete, research-backed framework for projecting the performance and capital needs of a high-volume pizza restaurant unit.
Core inputs and core outputs
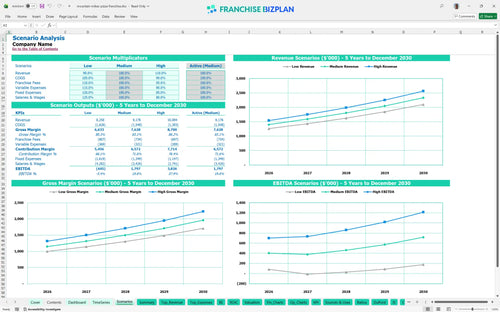
Three scenario analysis
Presentation ready

DuPont analysis
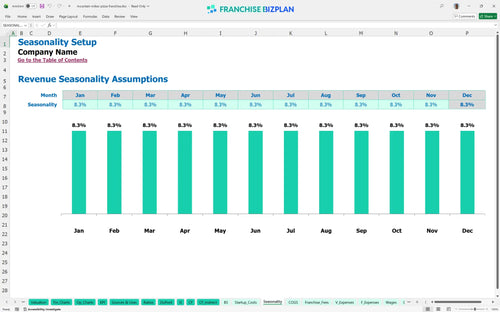
Researched revenue assumptions
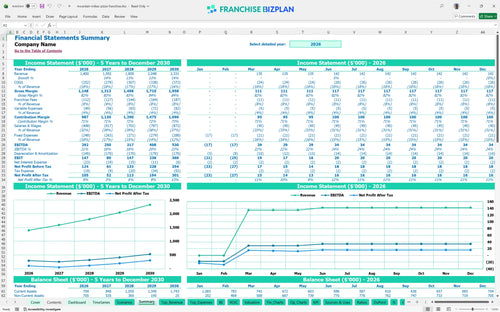
Lender-friendly financial outputs
Revenue stream detailed view
Performance metrics benchmark
We built this franchise unit financial model using our own research to provide a realistic view of the pizza industry. Key assumptions like the $30,000 franchise fee, 5% royalty rates, and staffing needs for a community-focused restaurant are pre-populated and fully editable. This tool helps you see how a $1.4 million first-year revenue target translates into store-level cash flow while accounting for specific costs like game room maintenance and community concierge roles.
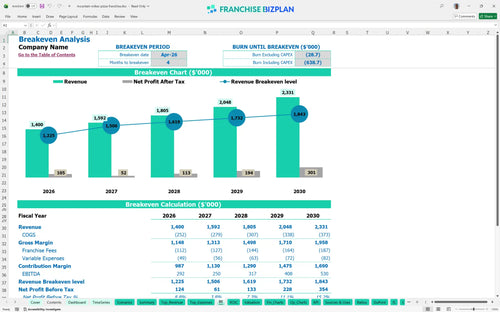
This unit reaches profitability quickly, with a break-even date in April 2026, just four months after opening. Year 1 EBITDA starts strong at $292,000 and grows to $530,000 by Year 5 as revenue scales and food costs drop from 16.5% to 14.5%. This franchise unit profitability forecasting shows a healthy upward trend as the store matures in its local market.
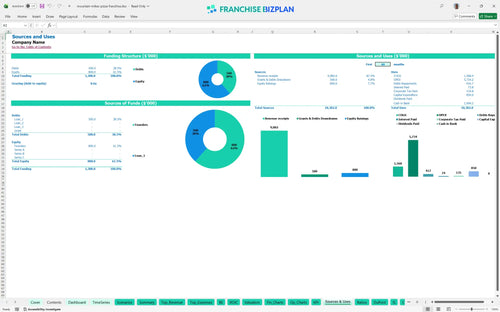
You need $850,000 in total capital to launch this unit, which covers the build-out, equipment, and initial fees. This pizza shop startup budget spreadsheet allocates the largest portion to leasehold improvements and kitchen gear to ensure the store meets high-volume standards. Knowing how to calculate pizza restaurant startup costs accurately prevents mid-construction cash shortages.
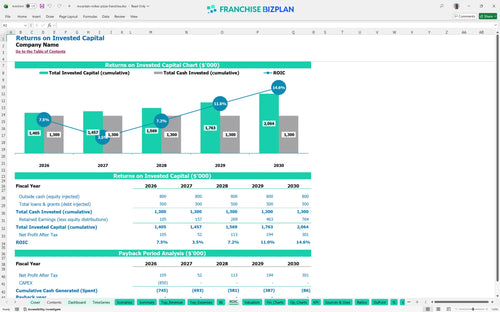
The model projects an Internal Rate of Return (IRR) of 2.09% and a Return on Equity (ROE) of 0.95 for the initial five-year period. While annual cash flow is robust, the total payback on the $850,000 investment occurs after Year 5 due to the significant upfront build-out costs. Evaluating pizza franchise ROI before investing helps you set realistic expectations for long-term wealth creation.
The unit hits its monthly break-even point in April 2026, provided it reaches the $1.4 million annual revenue pace. This restaurant franchise unit financial feasibility depends on maintaining a high average ticket and managing the $15,000 monthly rent. Labor is the biggest variable, so keeping your pizza cooks and servers aligned with peak traffic is the fastest way to cover fixed costs.
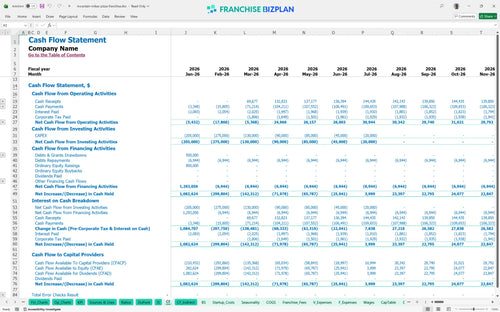
The lowest cash point is $477,000 in June 2026, which occurs after the final equipment payments and initial marketing push. You should defintely maintain a cash buffer to handle the ramp-up phase, as restaurant cash flow management is tightest in the first six months. The model shows a stable runway thereafter, supported by growing pizza and catering sales.
A high-performance scenario, driven by strong community concierge execution and sports team bookings, can push Year 5 EBITDA well above the $530,000 baseline. Conversely, a low-revenue case might extend the payback period and require more working capital during the first year. Using franchise investment analysis for new owners allows you to stress-test your $465,000 annual labor budget against different sales volumes.
Finance: update unit break-even and payback model by Friday
This pizza franchise financial model Excel template is a flexible tool designed for active operators who need to adjust variables on the fly. You can modify every formula and assumption to match your specific territory, from local labor rates to regional ingredient pricing. It simplifies complex projections so you can focus on store-level execution rather than spreadsheet math.

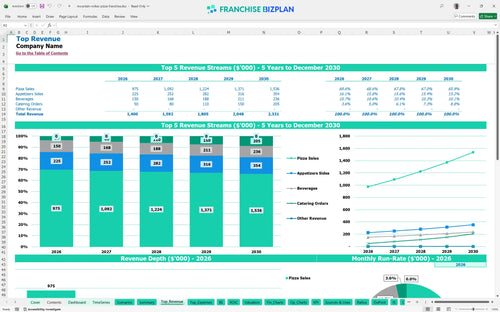
Planning for the long term is essential when building a restaurant franchise business plan that lenders will actually approve. This model provides a detailed 5-year outlook, showing how revenue grows from $1.4 million in year one to over $2.3 million by year five. It maps out the transition from a new store ramp-up to a mature, high-volume pizza shop financial projections with stable margins.

Managing the franchise unit profit and loss requires a clear view of your obligations to the franchisor before you pay your own bills. The model automatically calculates the 5% royalty and 3% marketing fund contributions based on your monthly gross sales. This ensures you always know exactly how much cash is left for local operations after meeting your brand standards and fee requirements.

Calculating food and labor costs for restaurants is only half the battle; you also need to know when you will stop burning cash. This franchise startup cost template outlines the $850,000 initial investment and identifies the exact sales volume needed to cover your $15,000 monthly rent and other fixed overhead. It provides a clear path to the break-even analysis so you can manage your working capital effectively during the first few months.

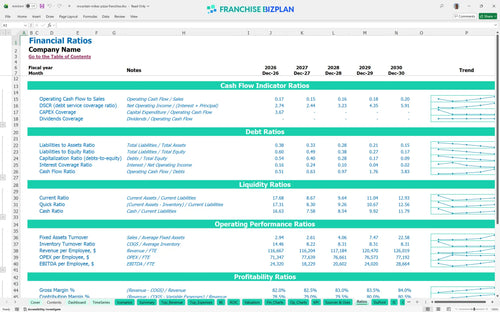
This model uses unit economic modeling to compare your projected performance against typical pizza industry standards. It includes a commercial lease and operating cost forecast that helps you sanity-check your $2,500 monthly utility budget and 16.5% food cost targets. By using these built-in benchmarks, you can identify if your operating expense ratio is out of line before you sign a lease.


Simply purchase and download the financial model template, then access it instantly using Microsoft Excel or Google Sheets. No installation or technical expertise required-just open and start working.

Enter your business-specific numbers, including revenue projections, costs, and investment details. The pre-built formulas will automatically calculate financial insights, saving you time and effort.

Leverage the investor-ready format to confidently showcase your financial projections to banks, franchise representatives, or investors. Impress stakeholders with clear, data-driven insights and professional reports.

Leverage the investor-ready format to confidently present your projections to banks, franchise representatives, or investors.