
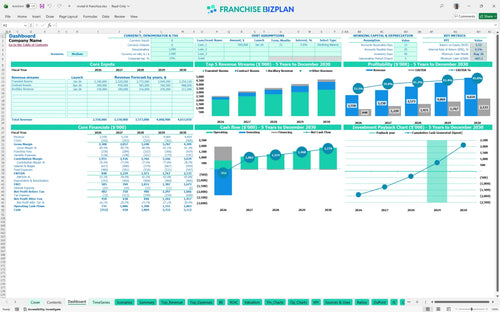
All-in-one Dashboard
Core inputs and core outputs


This franchise unit financial model template provides a data-driven framework for evaluating the performance and scalability of your hospitality investment.
Core inputs and core outputs
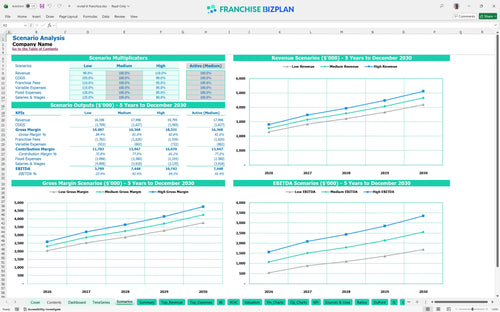
Three scenario analysis
Presentation ready
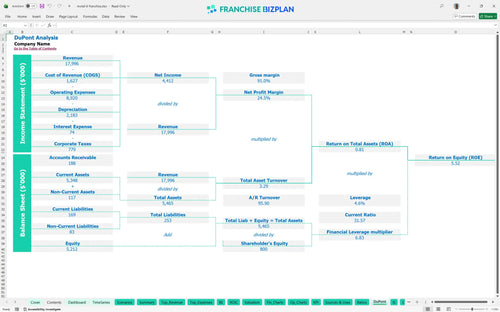
DuPont analysis
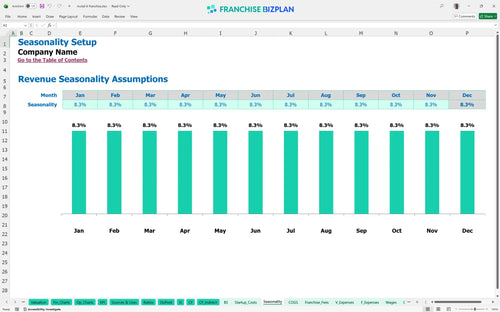
Researched revenue assumptions
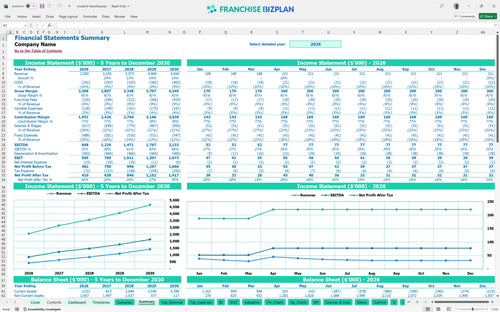
Lender-friendly financial outputs
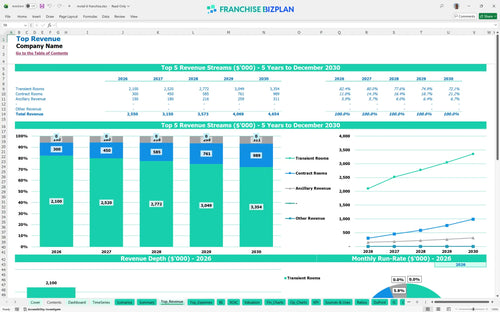
Revenue stream detailed view
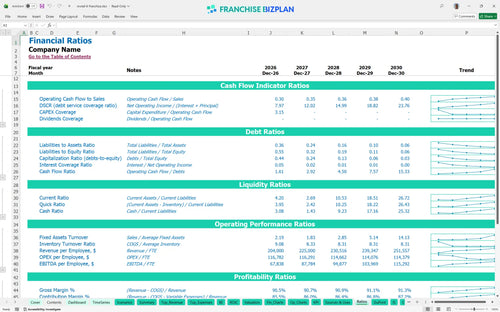
Performance metrics benchmark
We built this franchise unit financial model using our own research to ensure the motel unit economics reflect real-world market conditions. Key assumptions like the $2,550,000 Year 1 revenue and specific hotel franchise unit economics and profit margins are pre-populated and fully editable to match your specific site. This data-driven approach removes the guesswork from your hospitality investment planning.
The unit reaches profitability in its first year with an EBITDA of $848,000, eventually scaling to $2,133,000 by Year 5. This hotel franchise profitability analysis accounts for all guest amenities and laundry costs which average around 9% of total revenue. Profitability is a marathon, not a sprint.
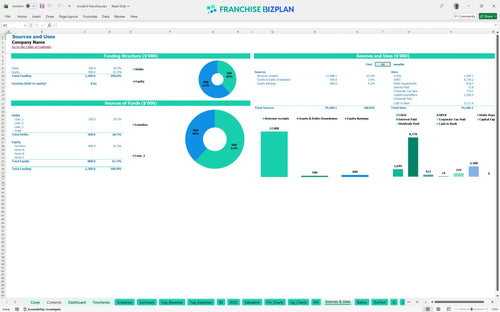
You need approximately $2,300,000 to launch, which includes the $35,000 franchise fee and $1,200,000 for the room design. This financial feasibility study for a motel franchise details how to calculate startup costs for a hotel franchise by categorizing every major expense from HVAC to signage. Capital is the fuel for your design upgrades.
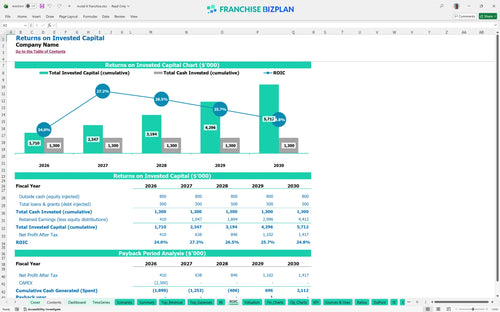
Based on the initial outlay, the franchise ROI calculator shows a 4.07% IRR and a 4-year payback period. While the ROE sits at 5.52%, the steady climb in EBITDA suggests strong long-term equity building for multi-unit operators. ROI is the only metric that truly settles the score.
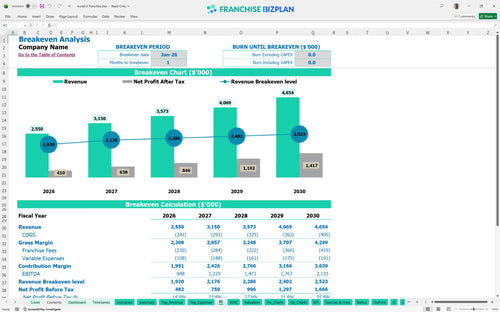
The unit hits its break-even point in January 2026, just one month after launch, due to strong initial demand. How to evaluate profitability of a budget hotel franchise depends on maintaining this pace using a financial template for new hotel franchise location that tracks fixed costs like the $25,000 monthly rent. Speed to break-even is the best risk mitigator.
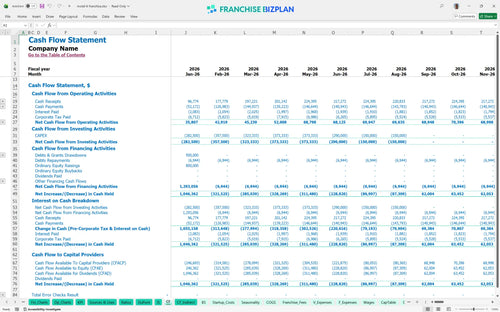
The lowest cash balance period occurs in August 2026, hitting -$603,000 during the ramp-up. You defintely need to plan for at least eight months of runway before the unit becomes self-sustaining. Cash is the oxygen of your new location.
The model compares scenarios to show how a 10% revenue drop affects your Year 1 margin and peak cash needs. Best practices for hotel franchise financial forecasting require testing these sensitivities to ensure the $1,200,000 room design investment remains viable even in a low-occupancy year. Scenarios prepare you for the reality of the market.
Finance: update unit break-even and payback model by Friday.
This budget hotel franchise financial model excel template is built for flexibility, allowing you to swap out assumptions as your local market dictates. It functions as a comprehensive franchise business plan template with pre-filled formulas that link your room rates directly to your long-term cash flow projections. One-size-fits-all models don't work in hospitality, so we made every driver editable.

Map out your hospitality franchise financial projections with a detailed 5-year view that tracks revenue scaling from $2,550,000 to over $4,654,000. This hotel franchise profitability analysis helps you visualize how occupancy gains and rate increases translate into bottom-line growth over a half-decade of operations. Five years is the minimum horizon for a hotel asset.

Our franchise fee structure analysis accounts for the 5% royalty and 4% marketing fund contributions required by the brand. Estimating royalty and marketing fees for hotel franchise operations is critical because these costs scale directly with your top-line revenue, impacting your net margin every month. Royalties are a top-line tax you must plan for.

Use this hotel franchise capital expenditure planning guide to manage your initial $2,300,000 investment across construction and equipment. By analyzing budget hotel franchise startup costs against your expected volume, the model identifies the exact occupancy level needed to cover your fixed monthly overhead. Knowing your break-even occupancy keeps you from flying blind.

The model includes hospitality industry benchmarking to help you verify if your hotel operating expenses, like the $4,500 monthly utility bill, align with sector norms. These built-in guardrails ensure your staffing levels and linen costs stay within a range that protects your store-level EBITDA. Benchmarks are the sanity check every CFO needs.


Simply purchase and download the financial model template, then access it instantly using Microsoft Excel or Google Sheets. No installation or technical expertise required-just open and start working.

Enter your business-specific numbers, including revenue projections, costs, and investment details. The pre-built formulas will automatically calculate financial insights, saving you time and effort.

Leverage the investor-ready format to confidently showcase your financial projections to banks, franchise representatives, or investors. Impress stakeholders with clear, data-driven insights and professional reports.

Leverage the investor-ready format to confidently present your projections to banks, franchise representatives, or investors.