
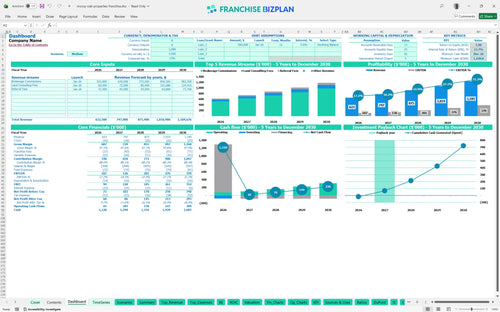
All-in-one Dashboard
Core inputs and core outputs


This Excel template for franchise unit financial forecasting includes a full franchise P&L statement, commission-based revenue modeling, and detailed startup capital requirements for a land office.
Core inputs and core outputs
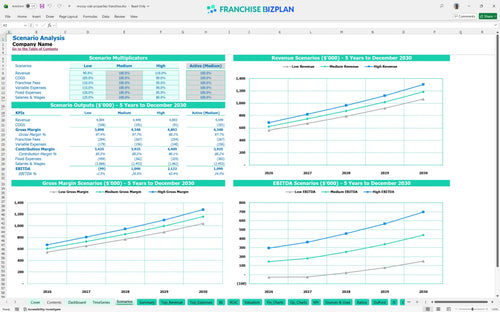
Three scenario analysis
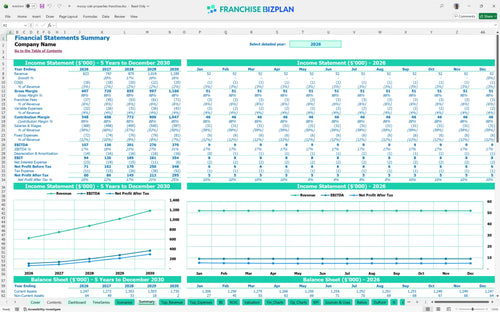
Presentation ready
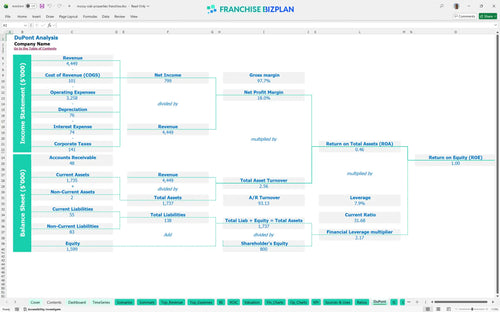
DuPont analysis
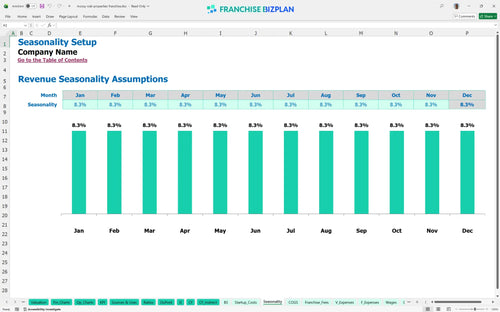
Researched revenue assumptions
Lender-friendly financial outputs
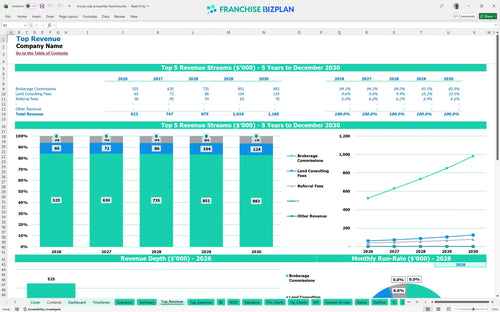
Revenue stream detailed view
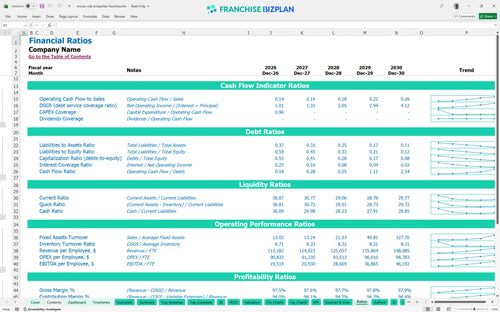
Performance metrics benchmark
We built this franchise unit financial model using our own research into the land brokerage sector. Key assumptions, including the $350,000 year-one brokerage commissions and 6% royalty fees, are pre-populated with researched data specific to Mossy Oak Properties Franchise franchise unit and are fully editable. This model tracks how a $107,000 year-one EBITDA scales as you add licensed agents to your territory.
This unit hits profitability almost immediately, with a breakeven date of January 2026. By year three, revenue projections for rural land brokerage show EBITDA climbing to $201,000 as you scale from 2 to 3 licensed agents and expand your land consulting fees. Profitability is a function of deal flow and commission splits.
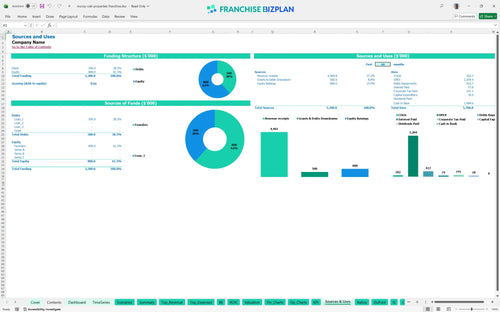
Launching this unit requires a focused investment in specialized equipment and branding. Your total initial capital covers the $15,000 franchise fee, $25,000 in office improvements, and $10,000 for drone cinematography gear to ensure high-end listing quality from day one. Capital is the fuel for your mountain market entry.
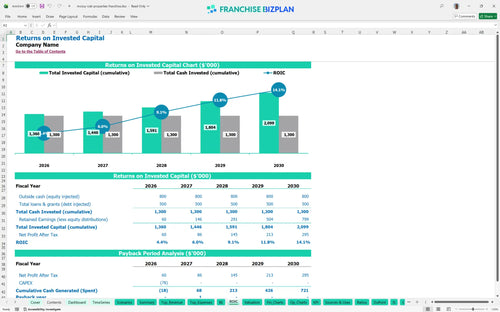
Investors can expect an Internal Rate of Return (IRR) of 13.7% and a Return on Equity (ROE) of 1. The return on investment analysis for real estate brokerage shows a payback period of just 2 years, driven by high average commissions and a lean $3,500 monthly rent. A two-year payback is a strong signal for investors.
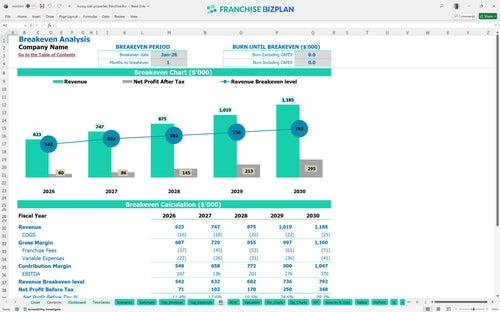
The office reaches its monthly break-even point in just one month. The break-even analysis for real estate franchise shows the primary driver is the low operating expenses for land brokerage franchise relative to high-value commissions, though maintaining a 1.5% MLS fee is critical. Speed to break-even reduces your personal risk.
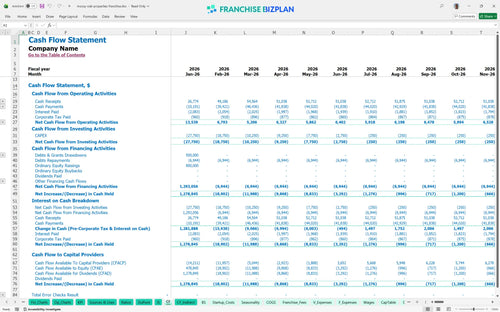
The lowest cash point hits in December 2026, requiring a minimum cash balance of $1,220,000 to maintain operations during the ramp-up. Financial planning for new franchise owners must account for the lag between listing a mountain tract and collecting the commission check. Cash is king, especially when land deals take time.
Our business feasibility study shows that a 10% drop in revenue pushes the payback period further out, while the high case sees EBITDA hit $370,000 by year five. The model allows you to toggle these scenarios to see how sensitive your $85,000 principal broker salary is to market fluctuations. Scenarios prepare you for the market's inevitable swings.
Finance: update unit break-even and payback model by Friday.
This franchise financial model template is a flexible Excel tool designed for real-world land brokerage operations. You can adjust every formula and assumption, from agent commission splits to local office overhead, making it easy to see how different mountain property markets impact your bottom line. Customization is the difference between a guess and a plan.

Building a real estate brokerage business plan requires a long-range view of the rural market. This financial model for rural land brokerage business delivers detailed 5-year projections for revenue, cash flow, and profit, helping you map out the growth from a single broker to a full team of land specialists. Five years is the standard for seeing a land office mature.

The model tracks your franchise royalty fee structure, specifically the 6% royalty on gross sales and the initial $15,000 fee. By factoring in these ongoing obligations, you get a clear picture of your net store-level margin after the brand takes its cut. Royalties are a fixed reality of the brand's value.

Knowing how to calculate startup costs for a real estate franchise is the first step to avoiding a cash crunch. This franchise startup cost analysis tool examines your total initial investment, including $25,000 for leaseholds and $10,000 for drone gear, to find the exact sales volume needed to cover your monthly $3,500 rent. Break-even is your first major milestone.

We defintely included built-in benchmarks to help you sanity-check your rural land brokerage financial projections. Compare your expected labor costs, like the $55,000 agent salaries, against typical ranges to ensure your franchise unit profitability model stays realistic. Benchmarks keep your ego in check.


Simply purchase and download the financial model template, then access it instantly using Microsoft Excel or Google Sheets. No installation or technical expertise required-just open and start working.

Enter your business-specific numbers, including revenue projections, costs, and investment details. The pre-built formulas will automatically calculate financial insights, saving you time and effort.

Leverage the investor-ready format to confidently showcase your financial projections to banks, franchise representatives, or investors. Impress stakeholders with clear, data-driven insights and professional reports.

Leverage the investor-ready format to confidently present your projections to banks, franchise representatives, or investors.