
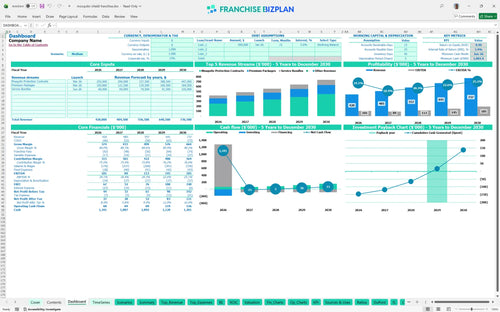
All-in-one Dashboard
Core inputs and core outputs


This comprehensive financial model template provides a complete five-year outlook for a service-based franchise unit, including automated cash flow statements and startup cost calculators. This tool simplifies complex franchise math into clear choices.
Core inputs and core outputs
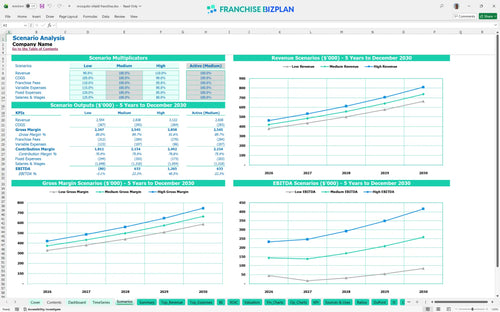
Three scenario analysis
Presentation ready
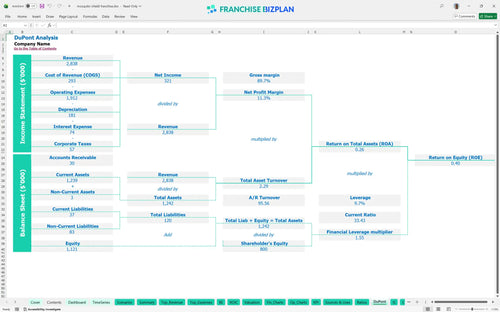
DuPont analysis
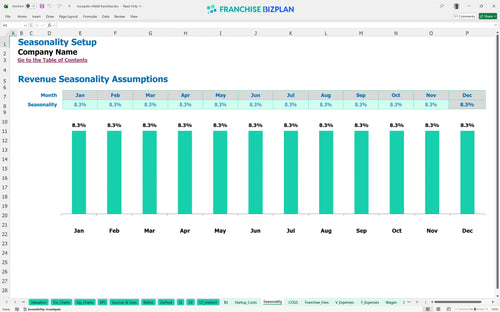
Researched revenue assumptions
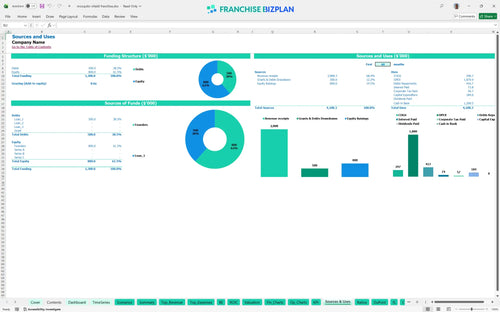
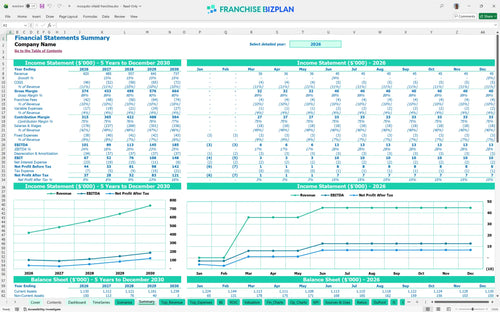
Lender-friendly financial outputs
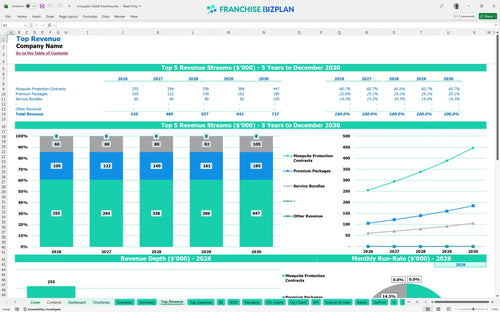
Revenue stream detailed view
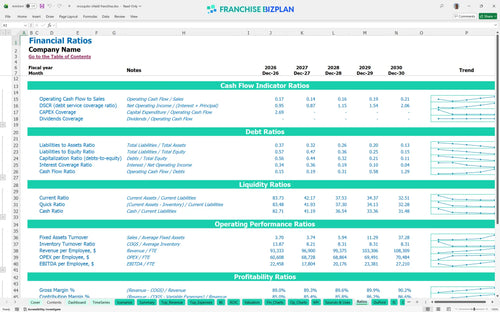
Performance metrics benchmark
We built this financial model using detailed research into the outdoor service sector to ensure your projections are grounded in reality. Key assumptions like your $420,000 year-one revenue target and the 3-month break-even timeline are pre-populated but remain fully editable to match your specific territory. This tool gives you a professional-grade starting point for your pest control franchise business plan template.
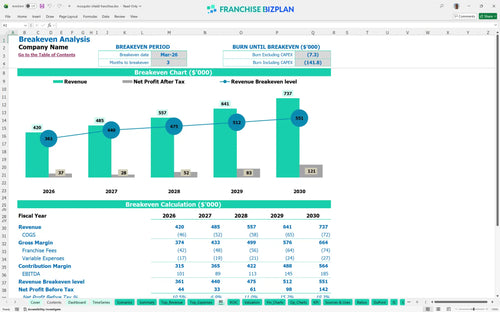
The unit reaches profitability in March 2026, generating $101,000 in EBITDA during the first year of operation. By year five, annual EBITDA is projected to grow to $185,000 as you scale your contract base and optimize technician routes. Speed to profit is the primary goal here.
Launching this unit in the US requires approximately $184,000 in initial capital to cover the franchise fee, equipment, and fleet setup. This includes $70,000 for two service vehicles and $25,000 for specialized spraying equipment to handle the proprietary treatment cycles. Cash is the fuel for your fleet.
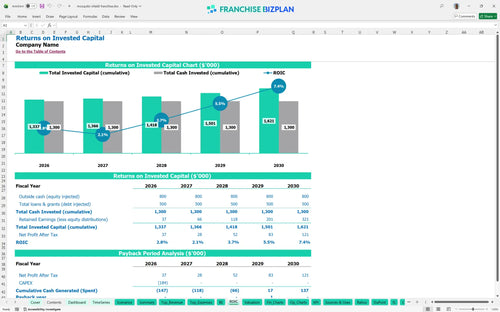
Investors can expect an Internal Rate of Return (IRR) of 3.44% and a Return on Equity (ROE) of 0.4 over the five-year period. The model projects a 4-year payback period to fully recoup the initial startup investment through operating cash flow. Focus on the long-term equity, not just the first year.
The monthly break-even point is reached in March 2026, just three months after starting operations. The primary driver for this quick turn is the volume of recurring protection contracts signed during the initial spring sales push. If you miss the early season window, your timeline defintely shifts. The first 90 days determine your year.
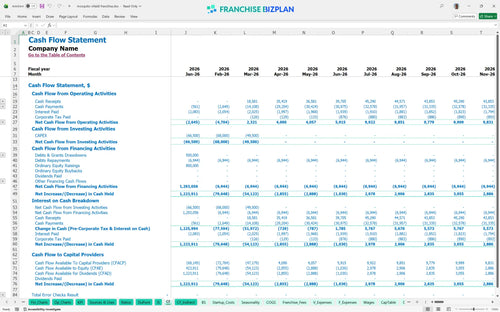
The lowest cash point occurs in June 2026 at $1,083,000, which indicates a significant capital buffer is maintained throughout the ramp-up phase. You should still monitor fuel and chemical costs closely as they fluctuate with service volume and local prices. Liquidity is your safety net during the spring rush.
A high-growth scenario significantly improves the 3.44% IRR by increasing the density of your service routes and the average ticket through premium bundles. Conversely, a low-revenue year makes the 10% combined royalty and marketing fee much harder to absorb against fixed costs. Success defintely depends on local marketing execution. Execution turns a medium plan into a high-growth reality.
Finance: update unit break-even and payback model by Friday
This Excel-based tool allows you to adjust every variable to see how local labor rates or rent shifts impact your bottom line. You can modify pricing for protection contracts or tweak technician wages without breaking the underlying math. It is built to be flexible so you can model a single territory or a larger expansion. Flexibility is the only way to plan for the real world.

The model provides a clear roadmap from your first $420,000 in year-one sales to a projected $737,000 by year five. It tracks how scaling your fleet and technician count affects long-term cash flow and net profitability. You get a full view of the balance sheet and income statement to share with lenders or partners. Growth is a marathon, not a sprint.

This section captures the 8% royalty and 2% marketing fund contributions that come off the top of your gross sales. It ensures you understand the impact of these fees on your store-level margin before you pay for fuel or labor. Tracking these obligations helps you manage your actual take-home pay more accurately. Royalties are a fixed reality of the system.

You can estimate your total initial investment, including the $54,500 franchise fee and the $184,000 needed for equipment and vehicles. The model identifies the exact sales volume required to cover your fixed monthly costs like the $1,000 office lease. Knowing this number helps you set realistic sales targets for your first season. Speed to break-even is your first major milestone.

The model uses researched data for pest control service margins, including a 9.5% cost for proprietary treatment solutions in your first year. These benchmarks let you sanity-check your fuel, insurance, and labor costs against typical industry ranges. It helps you spot if your spending is out of line with successful operators. Benchmarks keep your assumptions grounded in reality.


Simply purchase and download the financial model template, then access it instantly using Microsoft Excel or Google Sheets. No installation or technical expertise required-just open and start working.

Enter your business-specific numbers, including revenue projections, costs, and investment details. The pre-built formulas will automatically calculate financial insights, saving you time and effort.

Leverage the investor-ready format to confidently showcase your financial projections to banks, franchise representatives, or investors. Impress stakeholders with clear, data-driven insights and professional reports.

Leverage the investor-ready format to confidently present your projections to banks, franchise representatives, or investors.