
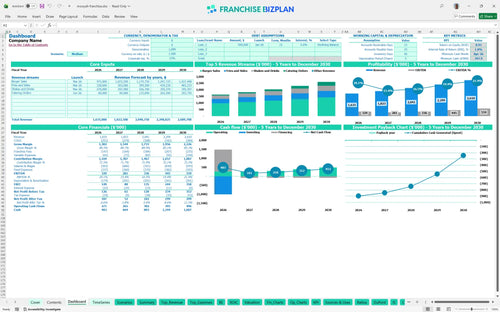
All-in-one Dashboard
Core inputs and core outputs


This comprehensive financial tool provides a detailed restaurant pro forma financial statement and interactive dashboard to help you evaluate, launch, and manage a high-performing burger franchise unit.
Core inputs and core outputs
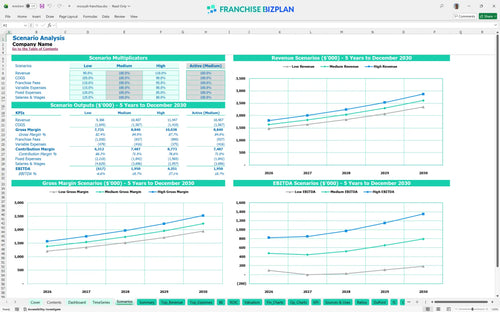
Three scenario analysis
Presentation ready
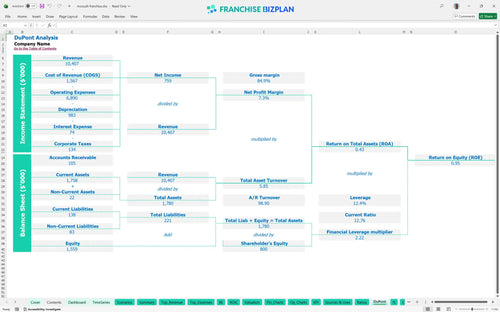
DuPont analysis
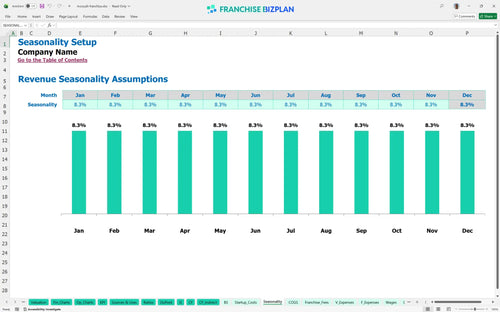
Researched revenue assumptions
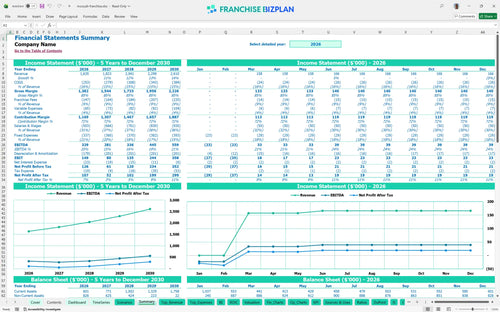
Lender-friendly financial outputs
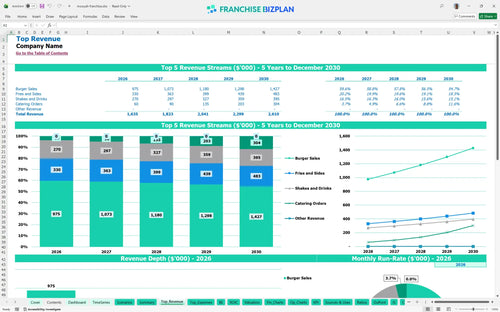
Revenue stream detailed view
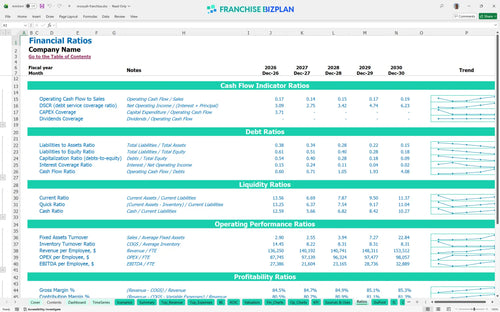
Performance metrics benchmark
We built this franchise unit financial model using our own research into the premium burger segment to ensure every line item reflects real-world operations. The model comes pre-populated with a detailed restaurant pro forma financial statement showing $1,635,000 in year-one revenue and an initial EBITDA of $329,000. You can use this as a guide for how to create a franchise business financial plan that accounts for everything from $250,000 in kitchen equipment to 6% royalty fees.
The unit achieves operational profitability immediately with a $329,000 EBITDA in year one, though net margins fluctuate as staffing scales. While EBITDA grows to $559,000 by year five, the high initial investment means you are focused on cash flow health in the early years.
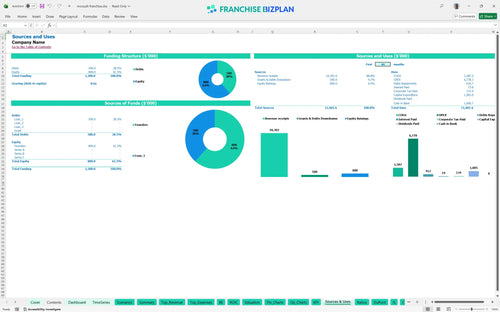
You need approximately $1,005,000 in total capital to cover typical startup costs for a fast-casual restaurant of this caliber. This capital expenditure budget covers the $40,000 franchise fee, extensive leasehold improvements, and a necessary $50,000 buildout contingency for Scottsdale-style premium finishes.
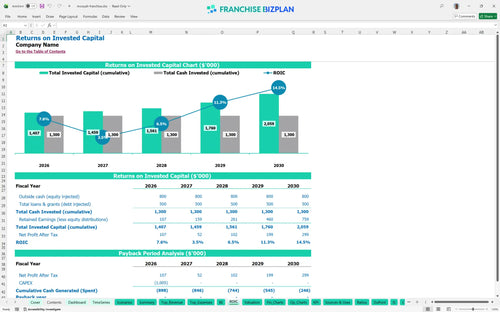
The franchise ROI calculation shows an internal rate of return (IRR) of 1.82% with a payback period extending beyond the five-year mark. This is defintely a long-term equity play where evaluating franchise investment opportunities depends on your ability to drive year-over-year revenue growth above the 10% baseline.
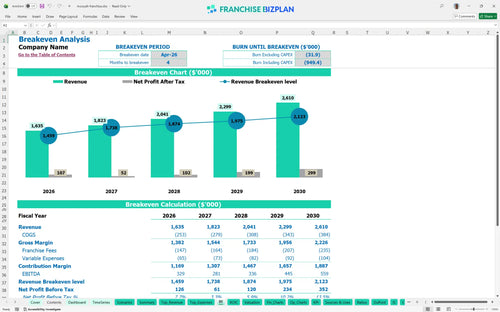
The unit hits its monthly break-even point in April 2026, just four months after the initial investment phase. Analyzing franchise unit operating margins shows that the $20,000 monthly rent is the primary fixed cost hurdle you must clear through high-volume burger and side sales.
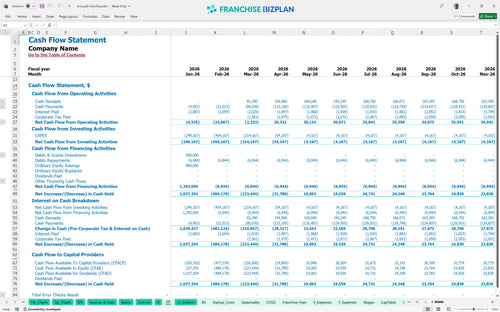
Your lowest cash point is $298,000 in April 2026, coinciding with the break-even month. You need to maintain this buffer to handle the ramp-up of the $145,000 initial management and supervisory salary burden before the full revenue stream matures.
A high-performance scenario driven by the restaurant catering revenue financial model can push year-five revenue well beyond $2.6M. Conversely, a low-revenue scenario makes the $20,000 rent and 9% combined franchise fees very difficult to absorb without significant local marketing execution.
Finance: update unit break-even and payback model by Friday.
This franchise financial model template is built in Excel to give you total control over your proyectons. You can adjust every variable from burger price points to hourly wages, and the pre-filled formulas will instantly update your entire forecast. It is the best Excel template for franchise unit profitability because it allows you to swap in your specific local rent or labor rates without breaking the logic. The restaurant business plan Excel structure ensures that your assumptions drive the results, not the other way around.

Success in a fast casual franchise investment requires looking past the grand opening to see how the unit matures over half a decade. This model delivers a detailed fast casual restaurant financial forecast template that tracks your trajectory from a $1,635,000 year-one revenue to over $2,610,000 by year five. By performing a deep franchise unit profitability analysis, you can see exactly how scaling sales impacts your bottom line as fixed costs stabilize. It provides the long-term clarity needed for multi-unit planning and debt service coverage.

Operating a branded unit means managing specific top-line hits like a 6% royalty and a 3% marketing fund contribution. This model automates these calculations so you can see the impact of restaurant operating expenses on your actual take-home pay. By tracking these ongoing obligations alongside a franchise P&L statement, you get a realistic view of your store-level margins. Analyzing franchise unit operating margins becomes much simpler when the franchisor's cut is baked into every revenue dollar automatically.

Knowing how to calculate startup costs for a burger franchise is the first step to avoiding a mid-build liquidity crunch. This tool aggregates your burger restaurant startup costs, including the $40,000 initial fee and $350,000 in leasehold improvements, to show your total entry price. It maps out the exact sales volume you need to hit to stop burning cash and start covering your $20,000 monthly rent. The break-even analysis helps you set realistic daily traffic targets for your management team from day one.

We have integrated franchise unit financial performance metrics to help you sanity-check your local operating assumptions against industry norms. Whether you are looking at unit economic modeling for labor or food costs, the model highlights where your numbers might be too optimistic or conservative. Comparing your projected 13% food ingredient cost against standard fast-casual ranges ensures your pro forma is grounded in reality. These benchmarks act as a guardrail for your financial planning process.


Simply purchase and download the financial model template, then access it instantly using Microsoft Excel or Google Sheets. No installation or technical expertise required-just open and start working.

Enter your business-specific numbers, including revenue projections, costs, and investment details. The pre-built formulas will automatically calculate financial insights, saving you time and effort.

Leverage the investor-ready format to confidently showcase your financial projections to banks, franchise representatives, or investors. Impress stakeholders with clear, data-driven insights and professional reports.

Leverage the investor-ready format to confidently present your projections to banks, franchise representatives, or investors.