
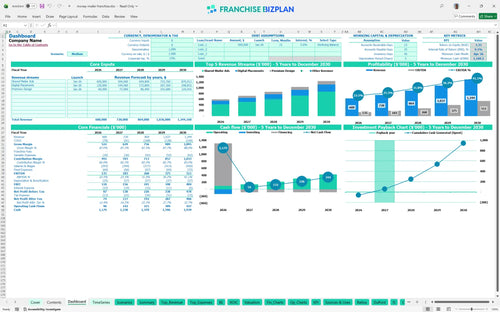
All-in-one Dashboard
Core inputs and core outputs


This comprehensive Excel tool provides a ready-to-use framework for evaluating franchise investment opportunities with pre-populated data for a direct mail marketing business.
Core inputs and core outputs
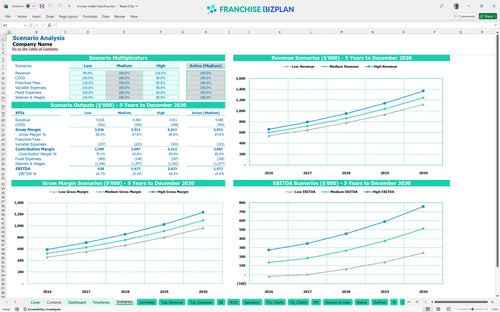
Three scenario analysis
Presentation ready
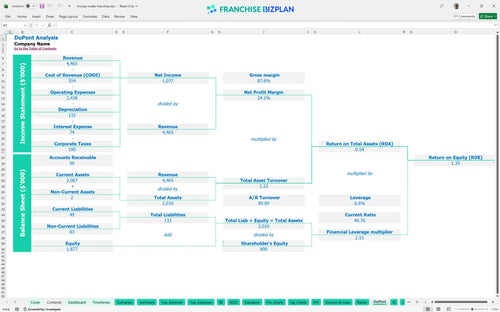
DuPont analysis
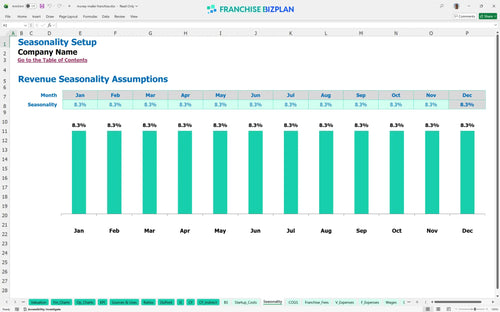
Researched revenue assumptions
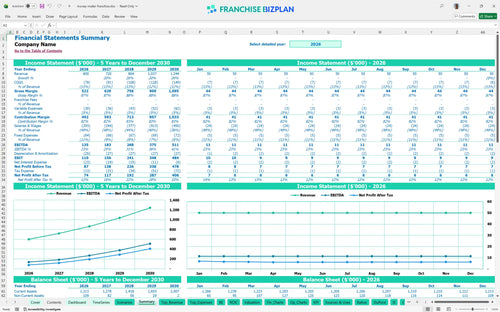
Lender-friendly financial outputs
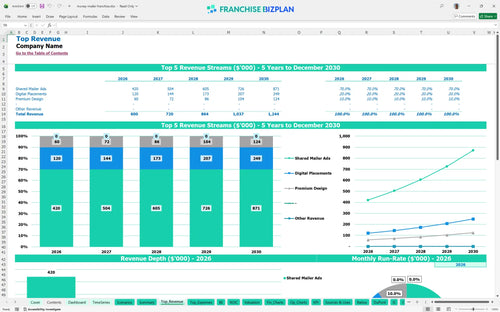
Revenue stream detailed view
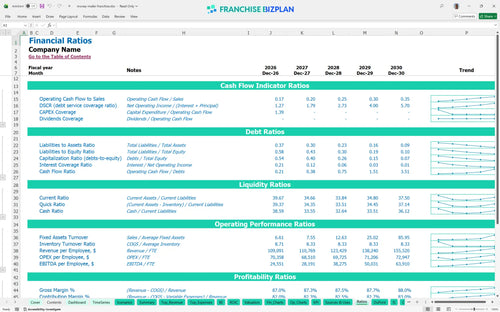
Performance metrics benchmark
We built this direct mail franchise financial model using detailed market research to help you evaluate a local advertising territory. The key assumptions, including revenue from shared mailers and digital placements, are pre-populated with researched data and are fully editable. With Year 1 revenue starting at $600,000 and EBITDA projected at $135,000, this model provides a data-driven starting point for your business plan.
This franchise unit is designed for a fast start, achieving profitability in the very first year with a projected $135,000 EBITDA. As you scale from 2 to 4 sales representatives, annual EBITDA is expected to climb to $511,000 by Year 5. This growth is driven by increasing shared mailer revenue and improving printing production efficiencies from 9.5% down to 8.5% of sales.
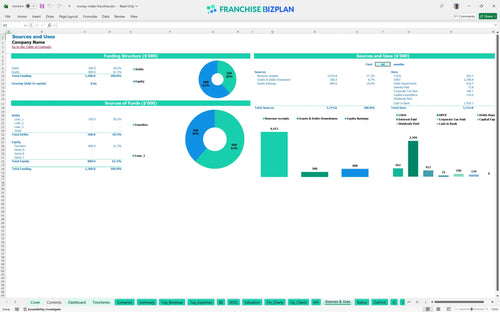
You will need $133,950 to launch this franchise unit in the US, covering everything from the initial fee to your first company vehicle. The model assumes you are funding this through equity or a small business loan to cover the $59,900 franchise fee and $18,000 office fit-out. This advertising franchise startup cost breakdown ensures you have enough liquidity to handle the $1,168,000 minimum cash requirement for long-term stability.
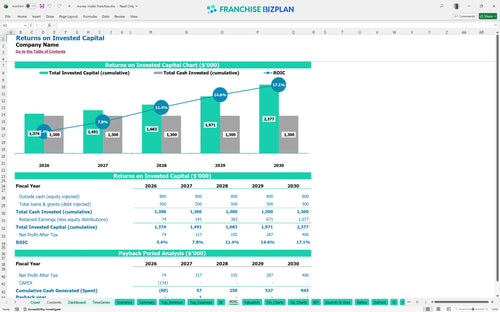
Investors can expect an Internal Rate of Return (IRR) of 9.05% and a Return on Equity (ROE) of 1.35 over the initial five-year period. The payback period is defintely efficient, with the unit returning the initial investment within 2 years. This ROI analysis assumes you hit your Year 1 target of $600,000 in total advertising sales across print and digital channels.
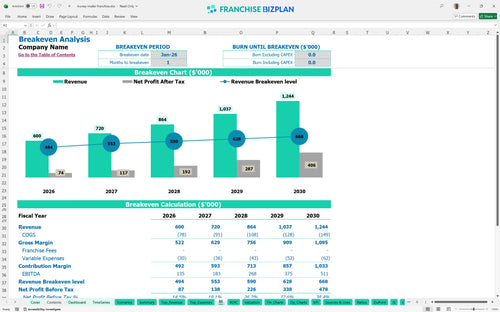
The unit reaches its monthly break-even point in January 2026, just one month after launch, due to the low overhead and immediate revenue potential of direct mail contracts. The primary driver for staying above break-even is maintaining a high volume of shared mailer ads, which account for $280,000 of Year 1 revenue. If sales commissions or digital fees spike, you must increase your average ticket to maintain your margin.
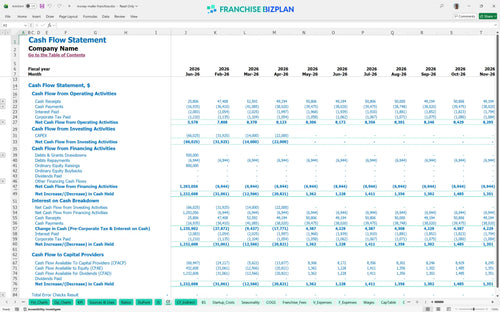
The lowest cash point occurs in April 2026, roughly four months after opening, requiring a significant cash buffer to handle the ramp-up of the sales team. While the model shows a high minimum cash balance of $1,168,000 to support multi-unit scaling or large-scale distribution, a single-unit operator must watch the timing of $15,000+ in monthly fixed costs. Managing the gap between ad sales and printing production payments is critical for survival.
In a High scenario where revenue grows 20% faster than the $600,000 Year 1 baseline, your EBITDA margin expands rapidly as fixed costs like the $3,200 office lease are diluted. Conversely, a Low scenario with stagnant sales would push the 2-year payback period further out and increase the peak cash need. The model shows that Year 5 profitability is highly sensitive to the number of sales representatives and their ability to drive $580,000+ in annual mailer ads.
Finance: update unit break-even and payback model by Friday.
This franchise financial model is a flexible Excel tool designed for local advertising agency franchise operators. You can easily adjust pre-filled formulas and editable assumptions to match your specific territory, whether you are scaling in a high-density urban corridor or a suburban market. It simplifies complex franchise unit economics so you can focus on sales strategy rather than spreadsheet troubleshooting.

Plan your long-term growth with detailed 5-year revenue, cost, and cash flow forecasts tailored for a service-based franchise. This franchise business plan template maps out the transition from a single-unit startup to a mature local advertising hub. By looking five years out, you can see how incremental gains in sales rep productivity and printing efficiencies compound into significant store-level margin.

This model tracks every franchise-specific obligation, from the initial $59,900 investment to ongoing operational costs. While this specific marketing services franchise model shows a 0% royalty and marketing fund structure in the current data, the tool allows you to plug in standard industry fees to test different contract scenarios. Understanding these fixed obligations is vital for protecting your store-level EBITDA (earnings before interest, taxes, depreciation, and amortization).

Estimating ROI for a local marketing franchise starts with a clear view of your total initial investment. This franchise unit financial projection spreadsheet breaks down the $133,950 startup cost, including office fit-out, vehicles, and equipment. The built-in break-even analysis identifies the exact sales volume needed to cover your $3,200 monthly rent and $15,000+ monthly payroll, ensuring you know your 'safety zone' from day one.

Use our built-in franchise profitability analysis to sanity-check your local advertising agency franchise performance against industry norms. The model includes benchmarks for printing production (starting at 9.5% of revenue) and mailing distribution (3.5%), helping you spot margin leaks early. Comparing your labor and occupancy costs against these standards ensures your financial forecasting for service-based franchises remains grounded in reality.


Simply purchase and download the financial model template, then access it instantly using Microsoft Excel or Google Sheets. No installation or technical expertise required-just open and start working.

Enter your business-specific numbers, including revenue projections, costs, and investment details. The pre-built formulas will automatically calculate financial insights, saving you time and effort.

Leverage the investor-ready format to confidently showcase your financial projections to banks, franchise representatives, or investors. Impress stakeholders with clear, data-driven insights and professional reports.

Leverage the investor-ready format to confidently present your projections to banks, franchise representatives, or investors.