
All-in-one Dashboard
Core inputs and core outputs


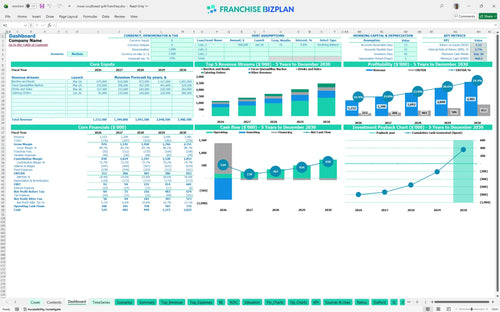
This comprehensive financial tool includes a 5-year P&L, startup cost tracker, cash flow forecast, and scenario manager designed specifically for a high-volume fast-casual restaurant.
Core inputs and core outputs
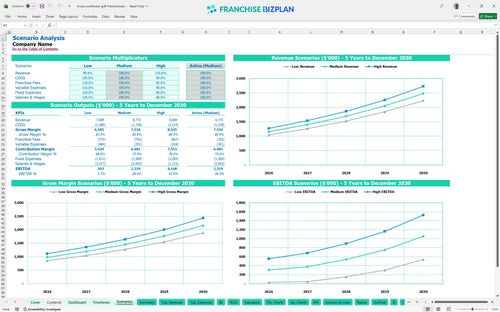
Three scenario analysis
Presentation ready
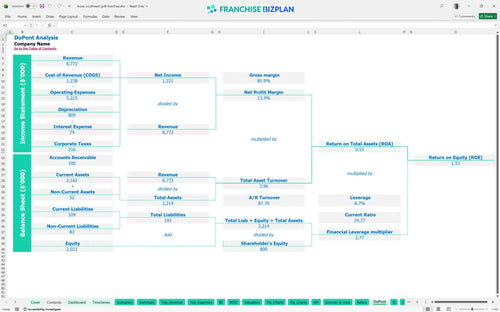
DuPont analysis
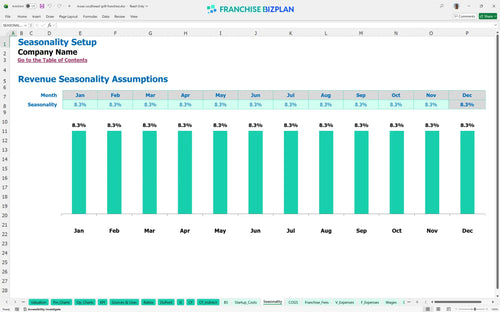
Researched revenue assumptions
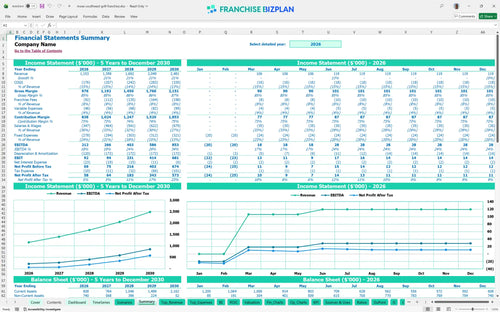
Lender-friendly financial outputs
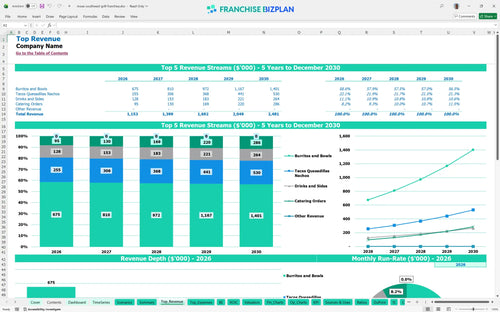
Revenue stream detailed view
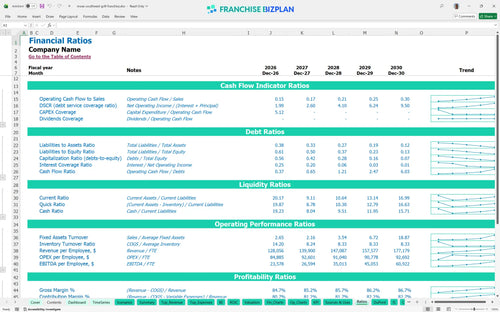
Performance metrics benchmark
We developed this financial model through extensive research into the unit economics of high-growth Southwestern fast-casual brands. All assumptions-including the $1.15 million year-one revenue target and the 8% combined fee structure-are pre-populated and fully editable to help you plan your South End location with confidence.
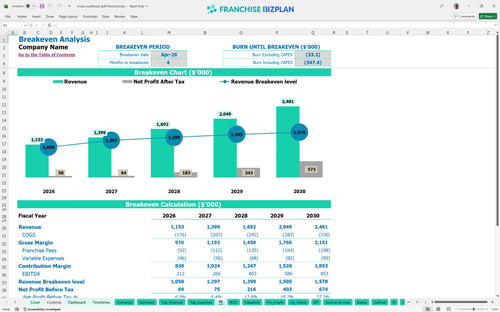
The model shows a strong upward path, with EBITDA forecasting starting at $212,000 in year one and climbing to $853,000 by year five. Estimating profitability for a fast casual franchise unit is straightforward here, as the unit hits its break-even date in April 2026, just four months after opening.
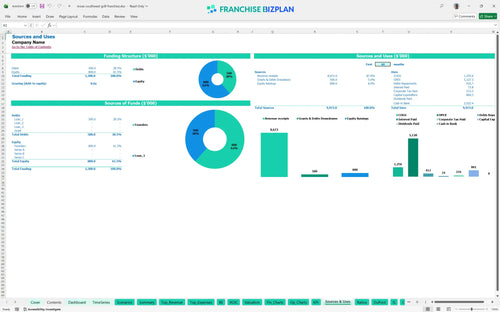
You need approximately $860,500 in capital expenditure to launch, covering the $30,500 initial fee and major equipment needs. Knowing how to calculate startup costs for a restaurant franchise is critical when leasehold improvements alone account for $450,000 of your initial cash outlay.
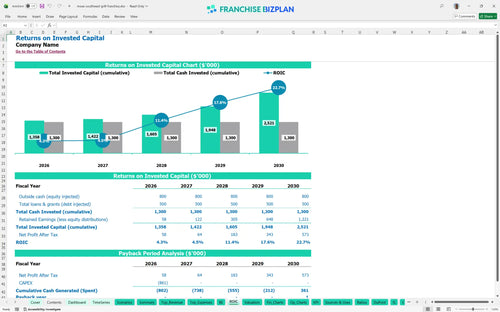
Investors can expect an Internal Rate of Return of 2.73% and a 5-year payback period based on the current growth trajectory. This franchise ROI calculator for prospective owners shows that while the initial spend is high, the mature cash flow defintely provides a stable long-term yield.
The break-even analysis for new franchise location shows you reach sustainability in month four, provided you maintain high throughput during lunch rushes. Your primary hurdle is the $18,000 monthly rent, which requires consistent daily traffic and a strong average ticket to cover.
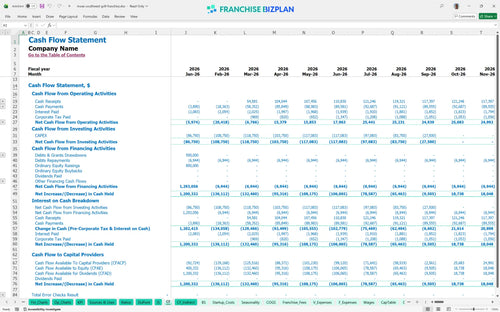
The lowest cash point occurs in September 2026 at $469,000, reflecting the heavy investment in build-out and early staffing. Operational expense tracking for restaurant franchises is vital during this ramp-up to ensure your $1,400 monthly property insurance and other fixed costs don't strain your liquidity.
Financial modeling for multi-unit franchise operators allows you to see how a 20% jump in catering revenue impacts your year-one margin. The high-case scenario, driven by a successful restaurant catering revenue forecasting model, can significantly accelerate your payback period and boost year-five EBITDA.
This franchise financial model is built in Excel with fully transparent formulas and editable assumptions, allowing you to adjust everything from local labor rates to specific site build-out costs. You can easily modify the drivers to match your specific territory, ensuring the projections reflect your actual operating environment rather than just a generic estimate.

Plan for long-term growth with a restaurant profit and loss template that covers five years of operations, mapping the journey from the first burrito served to a mature, high-volume unit. The model captures the ramp-up phase and the transition to stable margins, providing a clear view of how annual sales-projected to grow from $1.15 million to $2.48 million-impact your bottom line.

Managing the ongoing cost of brand affiliation is simple with dedicated inputs for the 5% royalty fees and 3% marketing fund contributions. This ensures you see the real-world impact of these obligations on your store-level EBITDA before you commit to the investment, keeping your overhead projections accurate and realistic.

Use this franchise startup cost calculator to estimate the total initial investment, including the $450,000 build-out and $220,000 in equipment. The model identifies the exact sales volume needed to cover your $18,000 monthly rent and other fixed costs, giving you a clear target for your first year of operation.

The model includes built-in unit economics and industry benchmarks to help you sanity-check your food costs and labor percentages. By comparing your projections against standard franchise disclosure document analysis, you can identify if your $72,000 manager salary or 12.5% initial food cost is in line with top-performing fast-casual units.


Simply purchase and download the financial model template, then access it instantly using Microsoft Excel or Google Sheets. No installation or technical expertise required-just open and start working.

Enter your business-specific numbers, including revenue projections, costs, and investment details. The pre-built formulas will automatically calculate financial insights, saving you time and effort.

Leverage the investor-ready format to confidently showcase your financial projections to banks, franchise representatives, or investors. Impress stakeholders with clear, data-driven insights and professional reports.

Leverage the investor-ready format to confidently present your projections to banks, franchise representatives, or investors.