
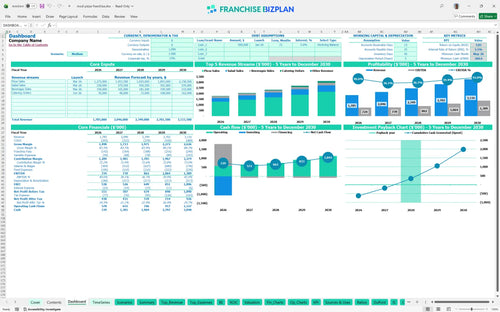
All-in-one Dashboard
Core inputs and core outputs


This comprehensive toolkit provides a detailed Excel-based projection system to evaluate the viability and performance of a fast-casual pizza location.
Core inputs and core outputs
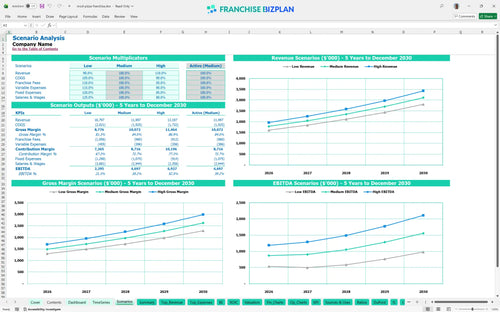
Three scenario analysis
Presentation ready
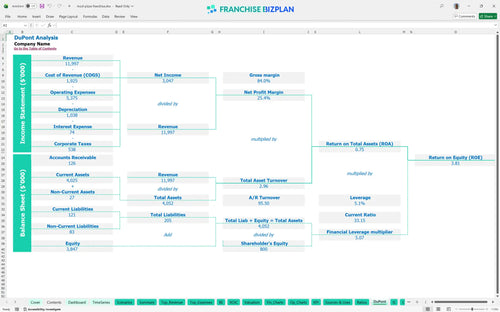
DuPont analysis
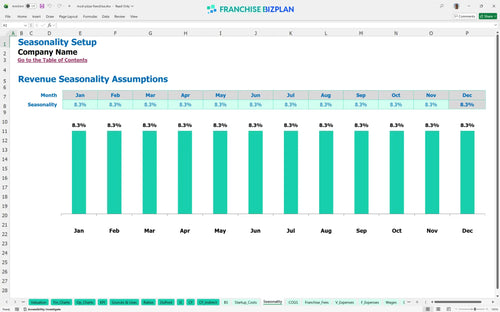
Researched revenue assumptions
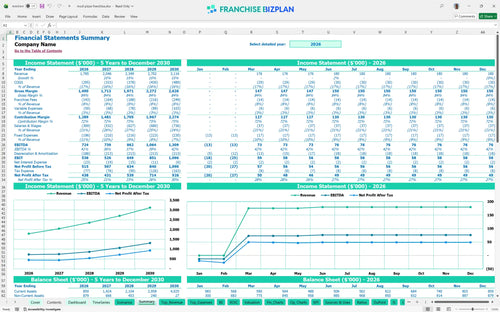
Lender-friendly financial outputs
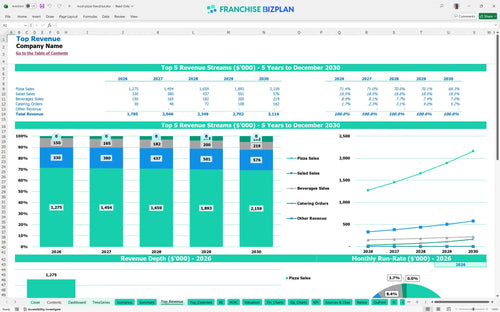
Revenue stream detailed view
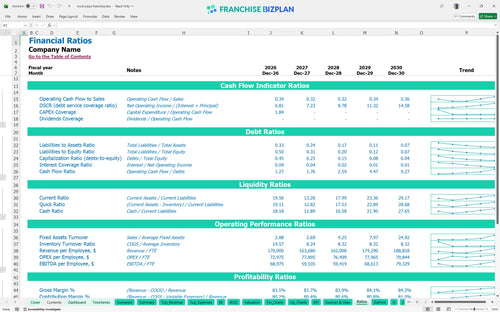
Performance metrics benchmark
We built this franchise unit financial model using our own research to provide a realistic view of store-level performance. Key assumptions like the 5% royalty, 3% marketing fee, and $11,000 monthly rent are pre-populated and fully editable. With year one revenue projected at $1,785,000 and EBITDA at $724,000, this model gives you a data-driven starting point for your investment.
The unit is projected to reach its breakeven date in March 2026, just three months after launch. This franchise unit profitability analysis shows that by managing food ingredients at 14% and estimating labor costs for quick service restaurants accurately, you can achieve a year-one EBITDA of $724,000.
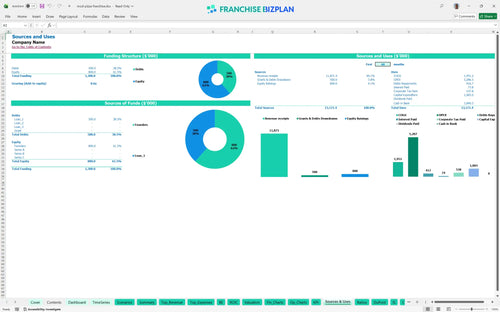
Starting this unit requires a capital expenditure forecast of approximately $1,065,000. This includes $550,000 for leasehold improvements, $120,000 for pizza ovens, and $180,000 for kitchen equipment, plus a $30,000 franchise fee and a $361,000 cash buffer for the ramp-up phase.
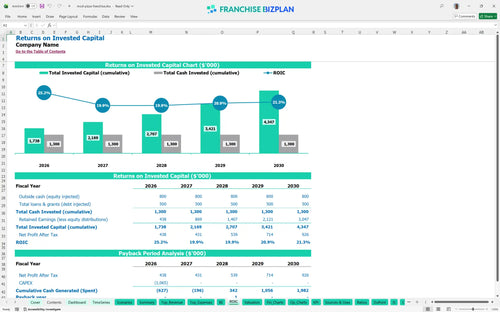
The ROI calculation for this unit shows an internal rate of return of 5.47% and a return on equity of 3.81. Based on the projected cash flows, the years to payback is 3 years, which is a standard expectation for a high-volume startup financial model for retail food franchise.
Calculating break-even point for new franchise location identifies March 2026 as the target month. To hit this, you must cover the $11,000 monthly rent and manage the 14% food cost percentage, with the primary driver being high-volume throughput during peak lunch and dinner hours.
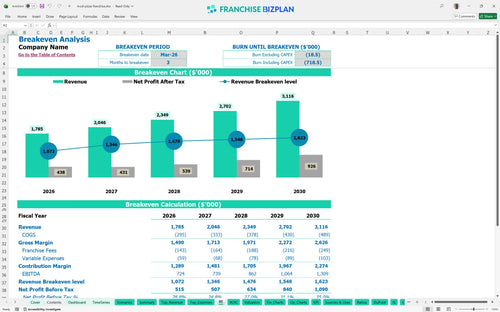
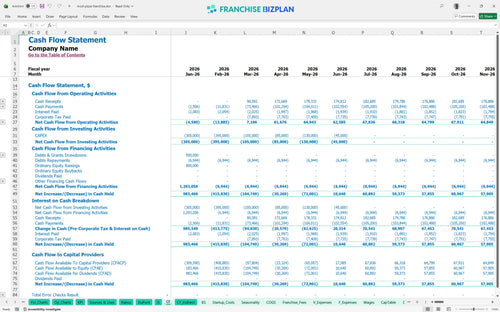
The lowest cash point is $361,000 in May 2026, meaning you need a solid financial spreadsheet for restaurant franchise owners to track your burn. If the build-out takes longer than 90 days, your cash runway will tighten, so maintaining a buffer is essential for surviving the ramp-up.
This fast casual franchise unit profit margin analysis shows that in a high-revenue case hitting $3,116,000 by year five, EBITDA margins expand significantly. But if food costs stay at 14% instead of dropping to 13.2%, your net profit will defintely take a hit, making it harder to maintain the 3-year payback. Still, analyzing food cost percentage for pizza franchises regularly helps you stay on target.
Finance: update unit break-even and payback model by Friday.
This franchise unit financial model is a fully customizable fast casual restaurant financial template in Excel, with pre-filled formulas and editable assumptions. You can easily adapt the staffing and payroll inputs or revenue drivers to fit your specific territory and local market conditions.

Planning for long-term success requires a solid QSR franchise business plan with detailed 5-year revenue, cost, and cash flow projections. This model helps you visualize the path to maturity for a franchise unit, ensuring you have a clear view of long-term profitability and balance sheet health.

Our model simplifies franchise disclosure document analysis by capturing all financial obligations, including the initial $30,000 fee and ongoing 5% royalty payments. It also tracks the 3% marketing fund contributions, so you can see exactly how these operating expenses impact your store-level margin.

Learning how to calculate startup costs for a pizza franchise is critical for any new operator. This tool estimates your total initial investment and monthly cost structure, helping you find the exact sales volume needed to cover both fixed and variable expenses.

This pizza restaurant financial projection excel template includes built-in industry benchmarks to help you sanity-check your unit economics. Compare your food cost percentage and occupancy costs against typical ranges to ensure your franchise investment feasibility study template is accurate and realistic.


Simply purchase and download the financial model template, then access it instantly using Microsoft Excel or Google Sheets. No installation or technical expertise required-just open and start working.

Enter your business-specific numbers, including revenue projections, costs, and investment details. The pre-built formulas will automatically calculate financial insights, saving you time and effort.

Leverage the investor-ready format to confidently showcase your financial projections to banks, franchise representatives, or investors. Impress stakeholders with clear, data-driven insights and professional reports.

Leverage the investor-ready format to confidently present your projections to banks, franchise representatives, or investors.