
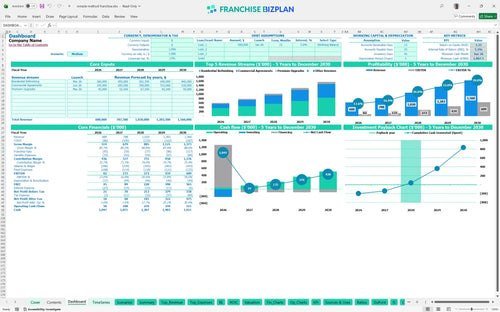
All-in-one Dashboard
Core inputs and core outputs


This Excel template for franchise unit financial planning provides a detailed budget template for new franchise owners to project five years of cash flow, profitability, and ROI.
Core inputs and core outputs
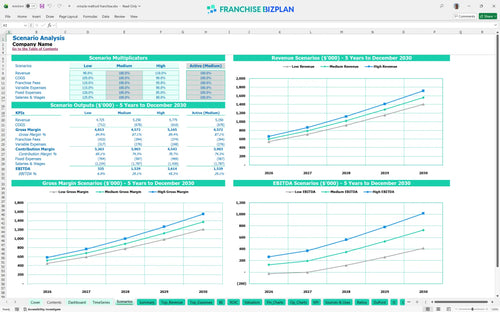
Three scenario analysis
Presentation ready
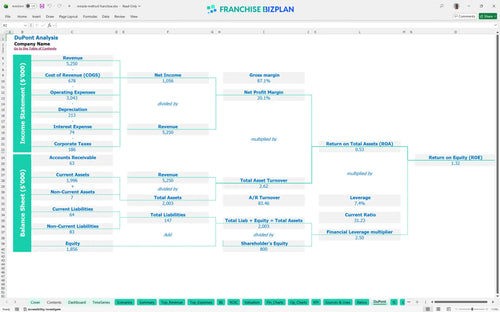
DuPont analysis
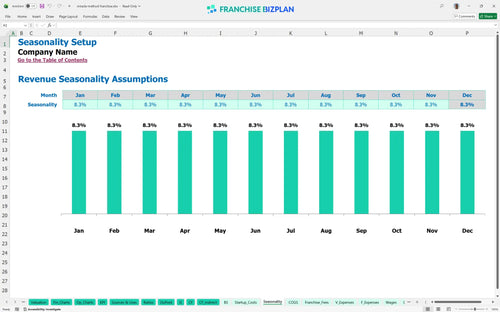
Researched revenue assumptions
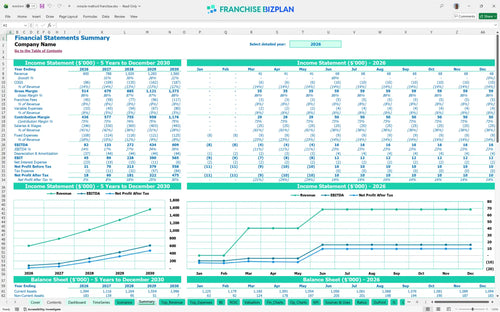
Lender-friendly financial outputs
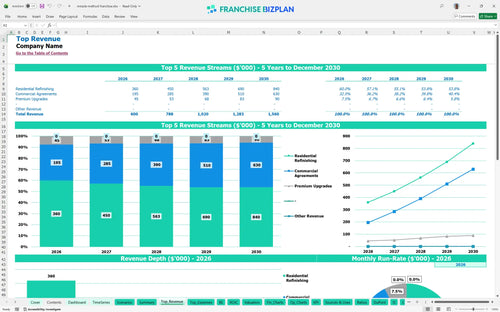
Revenue stream detailed view
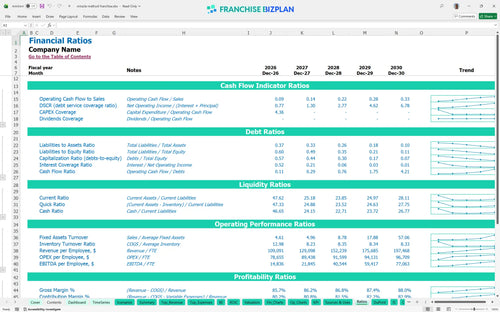
Performance metrics benchmark
We built this franchise unit financial model for the surface refinishing industry using our own research into territory performance and cost structures. Key assumptions like your $600,000 year-one revenue and 5.5% royalty fee are pre-populated and fully editable to match your specific location. With a projected year-five EBITDA of $609,000, this tool helps you map out the transition from a single technician to a full-scale service team.
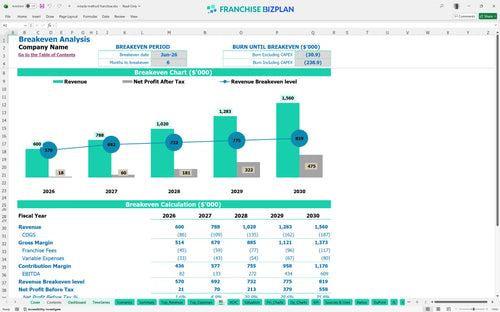
This surface refinishing franchise unit reaches its break-even point in June 2026, just six months after launch. By year five, you are looking at $609,000 in EBITDA as your materials costs drop to 10.5% of sales. Every dollar saved on materials flows straight to your bottom line.
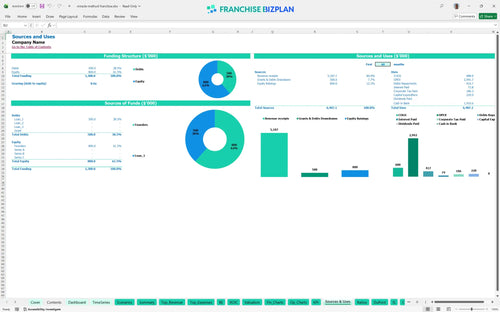
Launching this unit requires a total initial investment covering the $50,000 franchise fee and $60,000 for leasehold improvements. You also need to budget for $35,000 for a company vehicle and $25,000 for specialized equipment. Your truck is your office, so treat that $35,000 investment as a revenue engine.
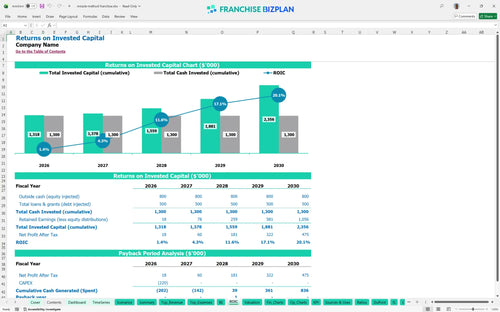
Analyzing ROI for bathroom and kitchen refinishing franchises shows a projected internal rate of return (IRR) of 5.17%. The payback period is estimated at 3 years, which is a solid win in the home services sector given the upfront equipment and showroom costs. Your return on equity is projected at 1.32.
The monthly break-even point occurs in June 2026, driven primarily by the ramp-up of residential refinishing and commercial agreements. Volume is the only way to outrun a $6,000 monthly rent check and the $204,000 in initial annual base salaries. Monitoring technician throughput is your most critical daily task.
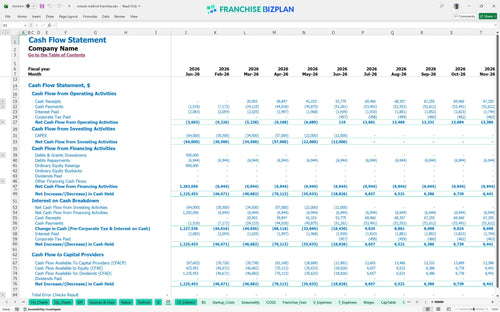
Your lowest cash point hits in June 2026 at $1,008,000, requiring a disciplined approach to working capital during the first two quarters. You defintely need to monitor the timing of your $12,000 initial inventory purchase against your first commercial payouts. Cash is king, but timing is the kingdom.
Comparing scenarios shows that a high-performing unit can reach $1,560,000 in revenue by year five, while a low-performing unit may struggle with the $204,000 base payroll. High performance isn't an accident; it's a result of local marketing grit and hitting your $560,000 residential target early.
This franchise unit financial model template is a fully customizable franchise business plan spreadsheet built in Excel. It features pre-filled formulas and editable assumptions that allow you to adapt the model to your specific territory, local labor market, and real estate costs. You can easily modify revenue drivers like average job size for residential refinishing or the number of units in a commercial agreement. The staffing and payroll inputs are designed to handle everything from lead technicians to administrative support, making it one of the best financial planning tools for franchise operators. Whether you are adjusting for local rent prices or utility rates, the model provides a clear view of how these variables impact your store-level margin.

Long-term planning is essential for any multi-unit operator or first-time owner, and this model delivers comprehensive 5-year financial projections. It maps out a clear path from your first $600,000 revenue year to a mature $1,560,000 operation. You get a detailed profit and loss statement for franchises that tracks revenue growth across residential, commercial, and premium upgrade streams. Beyond the P&L, the model provides a 60-month cash flow projection and a year-end balance sheet to help you understand your total equity position. This long-tail view is critical for estimating profitability for surface restoration businesses and ensuring you have the runway to reach your goals.

Understanding the franchise royalty fee structure is vital for protecting your margins in the home service sector. The model automatically calculates the 5.5% royalty and 2% marketing fund contributions based on your monthly sales forecasts. It ensures you account for every dollar owed to the brand before you calculate your own store-level EBITDA. By automating these calculations, the model helps you understand the real economics of the brand and how much volume you need to offset corporate overhead. It is a vital franchise investment analysis tool for anyone who wants to avoid surprises during their first year of operation.

Success starts with a clear understanding of your startup capital requirements and a realistic break-even analysis. This tool helps you learn how to calculate startup costs for a home service franchise by totaling your $220,000 in initial CAPEX, including equipment, vehicles, and showroom fixtures. It then maps these costs against your monthly fixed expenses, such as the $6,000 flex space rent and $1,400 in utilities. The break-even sales estimates show you exactly when your revenue will cover both your variable costs and fixed overhead. Knowing that you hit break-even in month 6 allows you to manage your cash reserves with confidence during the critical ramp-up phase.

Don't fly blind when estimating profitability for surface restoration businesses; use our built-in industry benchmarks to verify your numbers. The model includes specific targets for labor costs, which are a major driver in a service-based business with five or more employees. You can compare your 12.5% materials cost against industry standards to ensure you aren't overspending on supplies or consumables. These benchmarks serve as a unit economics analysis that highlights potential margin leaks before they become permanent problems. Using this tool, you can evaluate your projected gross margins and revenue per technician against the averages of a high-performing refinishing territory.


Simply purchase and download the financial model template, then access it instantly using Microsoft Excel or Google Sheets. No installation or technical expertise required-just open and start working.

Enter your business-specific numbers, including revenue projections, costs, and investment details. The pre-built formulas will automatically calculate financial insights, saving you time and effort.

Leverage the investor-ready format to confidently showcase your financial projections to banks, franchise representatives, or investors. Impress stakeholders with clear, data-driven insights and professional reports.

Leverage the investor-ready format to confidently present your projections to banks, franchise representatives, or investors.