
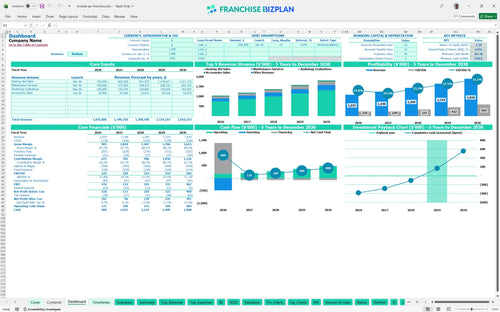
All-in-one Dashboard
Core inputs and core outputs


This comprehensive tool includes everything from capital expenditure planning to a monthly operating budget for boutique healthcare clinics.
Core inputs and core outputs
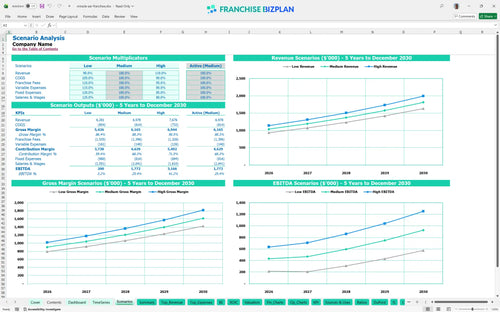
Three scenario analysis
Presentation ready
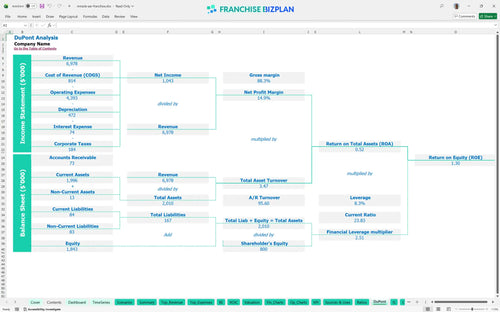
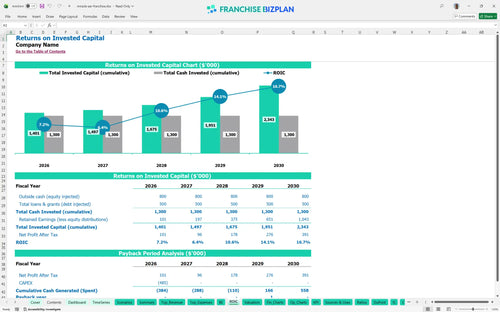
DuPont analysis
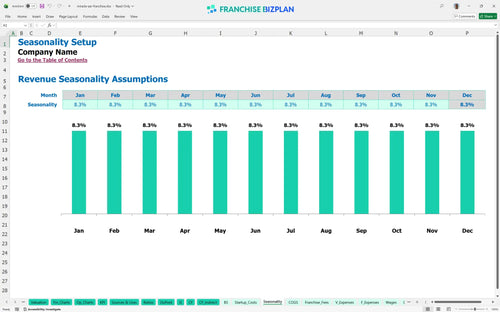
Researched revenue assumptions
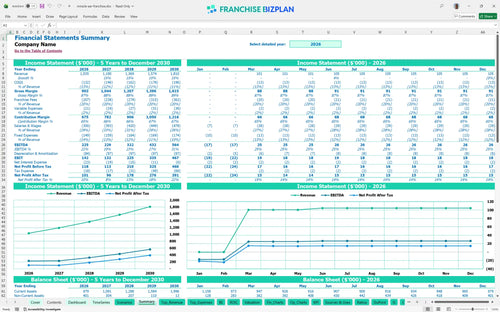
Lender-friendly financial outputs
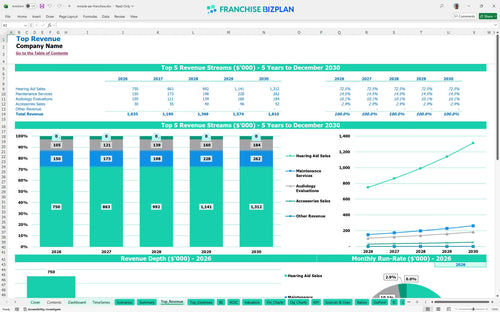
Revenue stream detailed view

Performance metrics benchmark
We built this hearing aid franchise business plan model using rigorous research into unit economics and startup requirements. It features pre-filled data like the $30,000 franchise fee and projected year-one revenue of $1,035,000, allowing you to start your analysis with a reliable baseline. All inputs are fully editable to reflect your local market conditions.
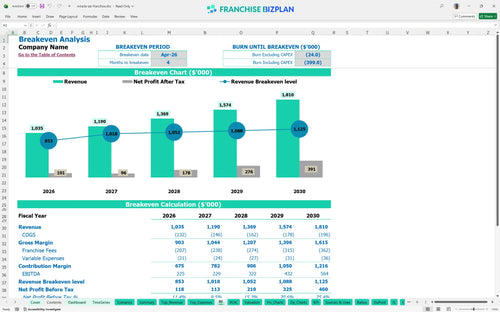
The unit hits positive EBITDA in year one at $225,000, growing to $564,000 by year five as the patient base matures. Analyzing profit margins for hearing aid centers shows that profitability scales as sales grow from $500,000 to over $874,000. Growth is steady but requires volume.
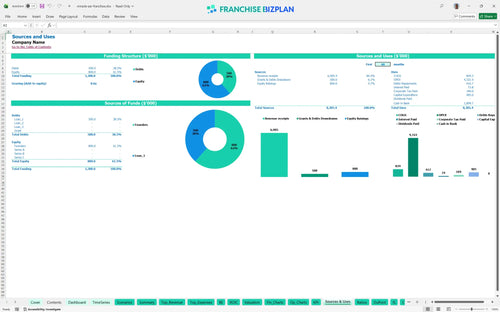
Learning how to calculate startup costs for a medical franchise reveals a total initial investment of $485,000 for this unit. This covers the $30,000 franchise fee, $200,000 in leasehold improvements, and $120,000 for diagnostic equipment. Cash is king during the build-out.
The ROI calculation for this unit shows a 4-year payback period and an internal rate of return (IRR) of 3.95%. These financial projections for senior care franchise opportunities suggest steady equity growth, with a return on equity (ROE) reaching 1.3. Patience pays off in year four.
The clinic reaches its break-even point in April 2026, just four months after the initial launch phase. Following best practices for franchise unit financial forecasting, we see that hitting this milestone depends on maintaining a disciplined $9,000 monthly rent. Speed to break-even is your best insurance.
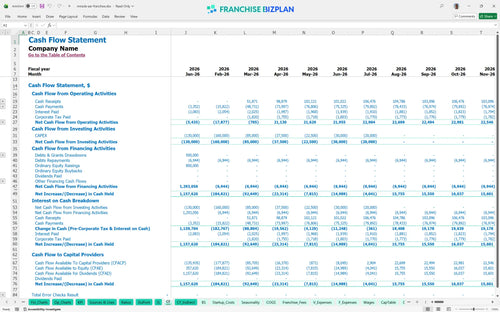
The lowest cash point occurs in July 2026 with $830,000 remaining, assuming you start with significant liquidity. Knowing how to build a cash flow model for a new franchise helps you navigate the gap between January build-out and June revenue. Watch the July dip.
Evaluating franchise unit economic viability shows EBITDA jumping if you can lower device costs from 11% to 9% by year five. High-revenue cases defintely improve the IRR, while low cases highlight the risk of the 20% royalty and marketing burden. Execution is the difference between profit and loss.
This franchise financial model template is a fully flexible Excel tool designed for retail health clinics. You can adjust pre-filled formulas and assumptions to match your specific territory, local rent prices, and staffing needs without needing a degree in finance. One tool for all your clinic math.

Long-term success requires seeing past the first year, so we included detailed healthcare franchise financial projections through 2030. This allows you to track how scaling from one to multiple providers impacts your bottom line as the patient base matures. Plan your exit before you even open.

Managing the 10% royalty and 10% marketing fee is critical for maintaining store-level margins in this model. By integrating these franchise disclosure document financials directly into the cash flow, you can see the exact impact of brand-related costs on your monthly take-home pay. Royalties are a top-line tax you can't ignore.

We simplify medical franchise startup costs by breaking down everything from leasehold improvements to initial inventory. The integrated break-even analysis shows you the exact sales volume needed to cover your $9,000 monthly rent and specialized payroll. Know your number before you sign the lease.

This franchise unit profitability analysis uses built-in benchmarks to ensure your labor and occupancy costs stay within healthy ranges for the hearing care sector. It helps you sanity-check your operating expense budget against real-world clinical standards. Don't guess when you can benchmark.


Simply purchase and download the financial model template, then access it instantly using Microsoft Excel or Google Sheets. No installation or technical expertise required-just open and start working.

Enter your business-specific numbers, including revenue projections, costs, and investment details. The pre-built formulas will automatically calculate financial insights, saving you time and effort.

Leverage the investor-ready format to confidently showcase your financial projections to banks, franchise representatives, or investors. Impress stakeholders with clear, data-driven insights and professional reports.

Leverage the investor-ready format to confidently present your projections to banks, franchise representatives, or investors.