
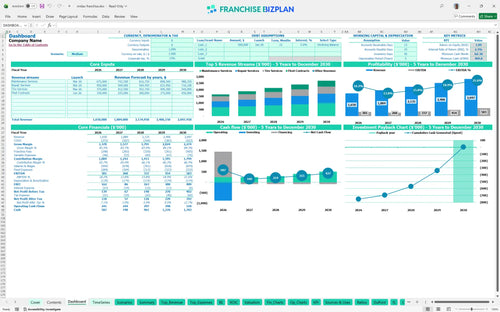
All-in-one Dashboard
Core inputs and core outputs


This tool provides a complete roadmap from the initial $35,000 franchise fee to a mature five-year operation with detailed cash flow and profit tracking.
Core inputs and core outputs
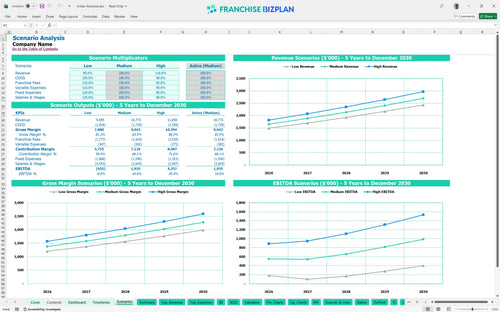
Three scenario analysis
Presentation ready
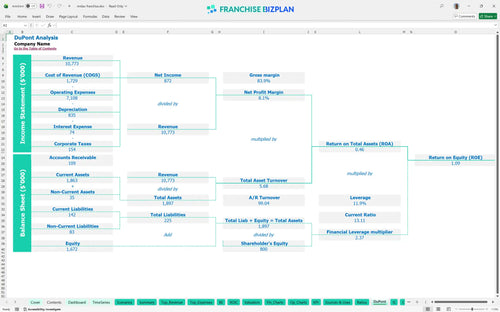
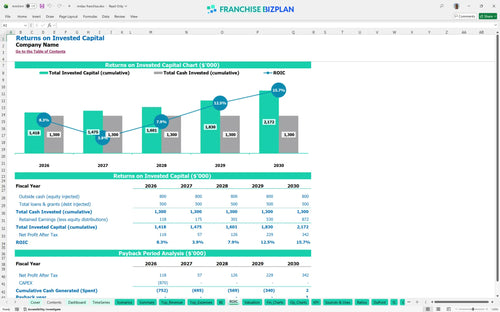
DuPont analysis
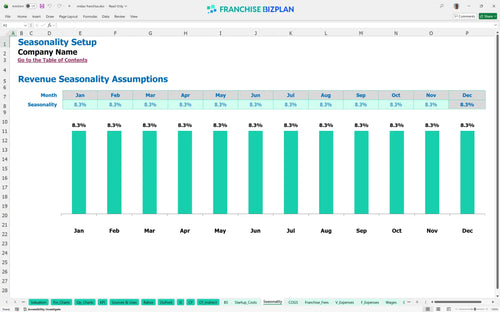
Researched revenue assumptions
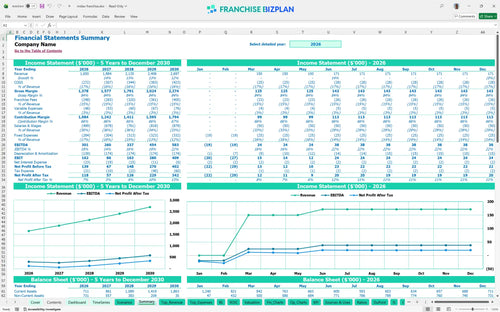
Lender-friendly financial outputs
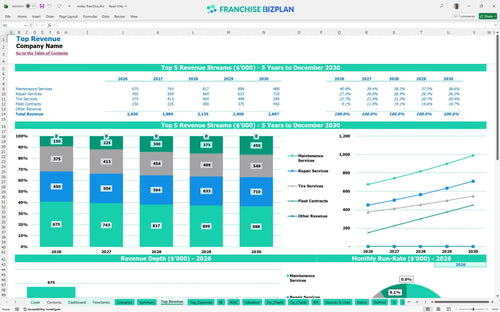
Revenue stream detailed view
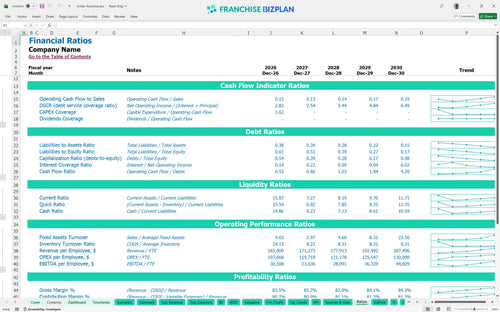
Performance metrics benchmark
We built this franchise unit financial model using our own research to provide a realistic look at the automotive service sector. Key assumptions including $1.65M in Year 1 revenue and 15% total franchise fees are pre-populated and fully editable. This tool helps you map out everything from the $350,000 build-out to the $583,000 Year 5 EBITDA.
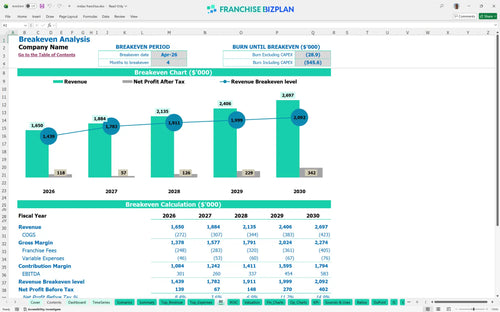
You hit the break-even point in April 2026, just four months after launching. By Year 5, EBITDA (earnings before interest, taxes, depreciation, and amortization) is projected to reach $583,000. This assumes you scale from $450,000 in maintenance services to over $658,000 as your local reputation grows.
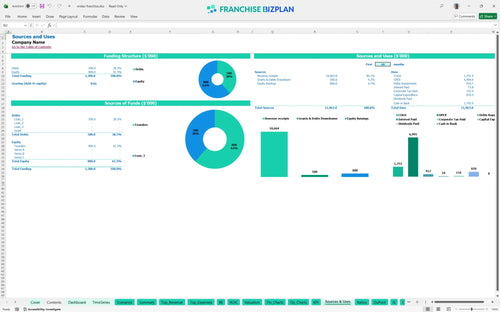
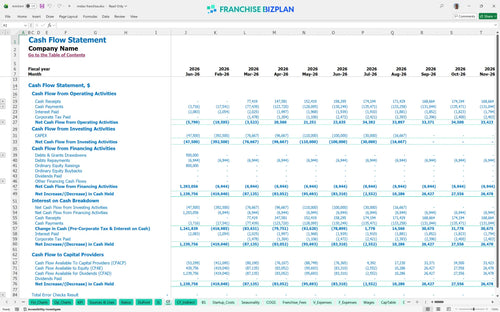
You need a significant war chest to get the doors open and survive the ramp-up. The model shows a minimum cash need of $469,000 by July 2026. This covers the $350,000 build-out, $200,000 in equipment, and the initial $35,000 franchise fee. To be fair, you will want a buffer for those first few months of rent and utilities.
The model projects a 5-year payback period with an Internal Rate of Return (IRR) of 2.29%. While the ROE (Return on Equity) sits at 1.09, the real value is in the long-term cash flow as revenue hits $2.69M by Year 5. Here's the quick math: you are trading a high upfront investment for a stable, recurring revenue stream in a prime location.
You reach break-even in month 4, which is quite fast for a heavy-CAPEX (capital expenditure) model. The biggest hurdle is the $15,000 monthly rent plus the 15% combined royalty and marketing burden. You need to move cars through those bays quickly to cover these fixed costs.
Your lowest cash point hits in July 2026 at $469,000. This is the danger zone where your initial investment is out the door but revenue has not fully ramped. Still, the model shows you stay liquid if you hit your $1.65M Year 1 sales target. If opening takes 90+ days longer than planned, your working capital pressure will rise defintely.
In a High scenario, hitting $2.69M in revenue earlier significantly improves your IRR and shortens the 5-year payback. Conversely, a Low scenario with 14% parts costs and high labor turnover could push break-even past Year 1. What this estimate hides is the impact of local competition on your $55,000 technician salaries.
This automotive franchise financial model is fully customizable in Excel, allowing you to swap out every variable to match your specific market. You can adjust the $15,000 monthly rent or the 4.0 initial technician headcount to see how it hits your bottom line. It's built for speed, so you aren't stuck building formulas from scratch. Honestly, a model is only as good as its inputs, and this one makes editing easy.

Looking five years out is the only way to see if the $1.65M Year 1 revenue scales into a sustainable $2.69M business. This model tracks your growth from four bays to a fully staffed service center. It maps out the EBITDA (earnings before interest, taxes, depreciation, and amortization) climb from $301,000 to $583,000. Planning for the long haul helps you avoid the Year 2 slump when initial excitement fades but costs remain.

Royalties and marketing funds are the franchise tax that can eat your margin if you aren't careful. This template bakes in a 10% royalty and a 5% marketing fee right off the top. At $1,650,000 in Year 1 sales, that is $247,500 leaving the building before you pay a single technician. We track these recurring costs so you know exactly what is left for your own pocket.

You need to know when you stop bleeding cash and start making it. With $350,000 in leasehold improvements and $200,000 in bay equipment, the initial hill is steep. This model calculates the exact month-April 2026 in our base case-where your revenue covers every fixed and variable expense. Knowing your break-even number helps you sleep better when the shop is quiet.

Don't guess if your 14% parts cost is normal; use the benchmarks. We have included standard ranges for automotive service to ensure your projections stay grounded in reality. If your labor costs are way higher than the $48,000 per service advisor average, the model flags it. It is a sanity check for your business plan.


Simply purchase and download the financial model template, then access it instantly using Microsoft Excel or Google Sheets. No installation or technical expertise required-just open and start working.

Enter your business-specific numbers, including revenue projections, costs, and investment details. The pre-built formulas will automatically calculate financial insights, saving you time and effort.

Leverage the investor-ready format to confidently showcase your financial projections to banks, franchise representatives, or investors. Impress stakeholders with clear, data-driven insights and professional reports.

Leverage the investor-ready format to confidently present your projections to banks, franchise representatives, or investors.