


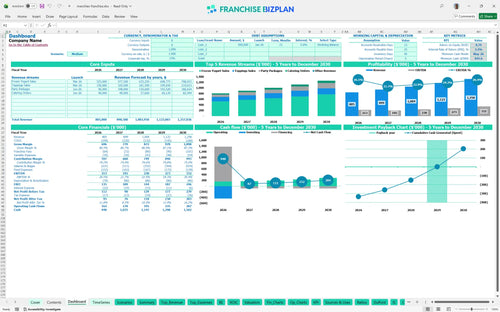
All-in-one Dashboard
Core inputs and core outputs



The franchise financial model for small business investors includes a complete Excel template for franchise unit financial planning with integrated cash flow, income statements, and CAPEX tracking.
Core inputs and core outputs
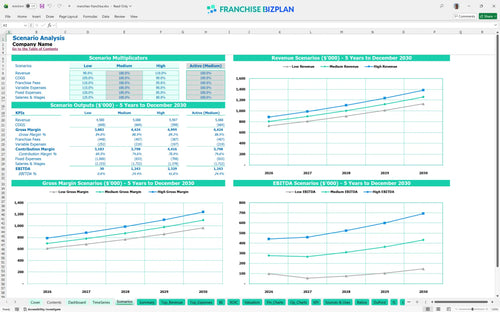
Three scenario analysis
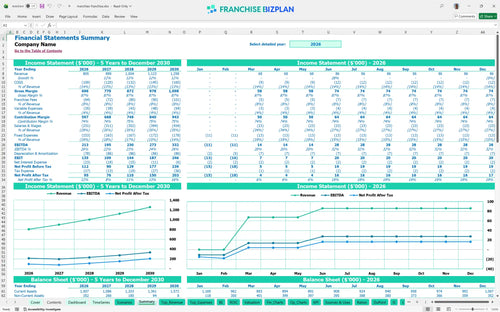
Presentation ready
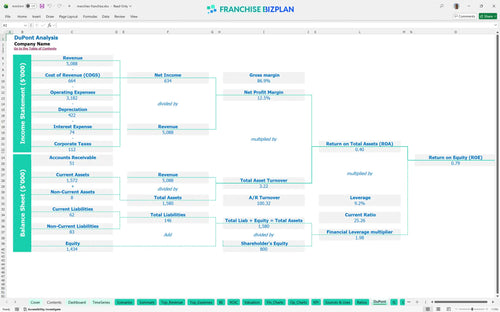
DuPont analysis
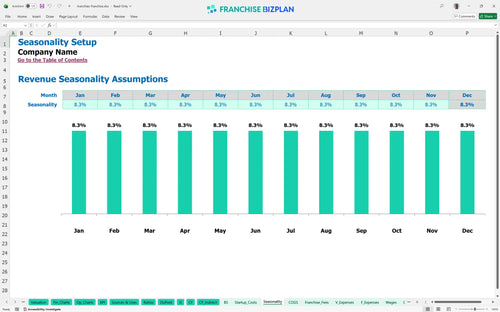
Researched revenue assumptions
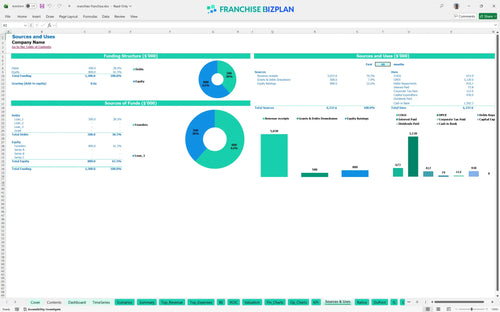
Lender-friendly financial outputs
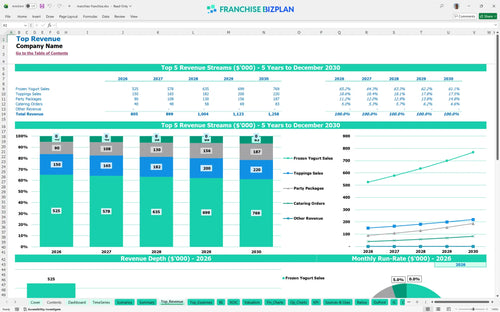
Revenue stream detailed view
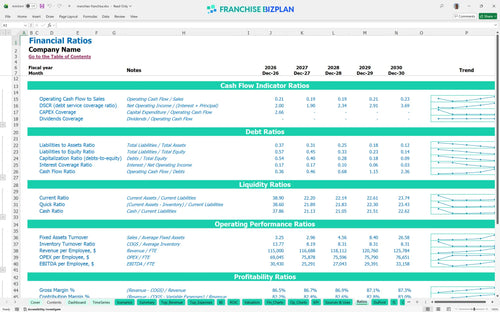
Performance metrics benchmark
We built this frozen yogurt franchise business plan using detailed research on self-serve dessert operations. Key assumptions like the $805,000 Year 1 revenue, 11% yogurt mix COGS, and $430,000 total startup cost are pre-populated and fully editable to help you prepare a business budget for a new franchise location.
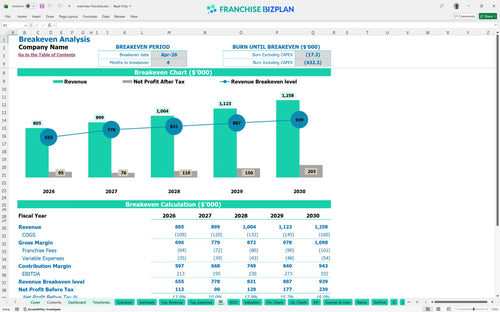
The unit reaches profitability quickly, hitting its break-even date in April 2026, just four months after opening. With Year 1 EBITDA projected at $213,000, the model shows a steady climb in earnings as you scale toward $1.25 million in annual sales by Year 5.
You need approximately $430,000 to launch this unit in the US market. This covers everything from the initial $40,000 franchise fee to the $85,000 for specialized yogurt machines and $150,000 for leasehold improvements to ensure your site meets brand standards.
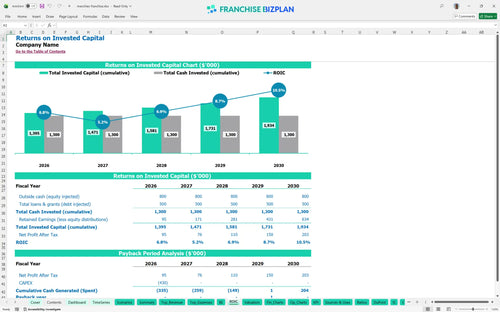
Based on the franchise investment return on investment analysis, you can expect a 3.23% IRR and a 4-year payback period. While the ROE stands at 0.79, the long-term value is driven by the consistent cash flow generated as the unit matures and local demand stabilizes.
The monthly break-even point is reached in month four, primarily driven by your ability to cover the $9,500 monthly rent and 6% royalty burden. Success defintely depends on maintaining high throughput during peak hours and managing the 13.5% total COGS for yogurt and packaging.
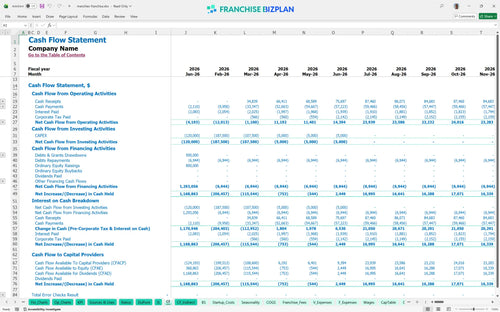
The lowest cash point occurs in May 2026 with a minimum cash balance of $846,000, assuming you start with sufficient working capital. This franchise unit cash flow projection spreadsheet suggests keeping a buffer to handle the ramp-up phase before the party and catering revenue streams fully kick in.
Financial forecasting for retail food service franchises shows that a High scenario, reaching $1.25M in revenue, significantly accelerates your payback. Conversely, a Low scenario with weak local marketing execution could delay your break-even by several months and increase your peak cash need during the first year.
This franchise financial model template is built in Excel with fully editable assumptions and pre-filled formulas. You can easily adjust the revenue drivers, staffing levels, and local operating expenses to match your specific territory and market conditions without breaking the logic.

Plan your long-term growth with detailed franchise unit financial projections that cover everything from day-one launch to year-five maturity. The model tracks revenue scaling from $805,000 to over $1.25 million, providing a clear view of your retail franchise profit and loss template over time.

Managing ongoing royalty fees and brand fund contributions is critical for maintaining store-level margins. This model automatically calculates the 6% royalty and 2% marketing fees against your gross sales, ensuring your capital expenditure forecasting accounts for all brand-mandated financial obligations.

Use the franchise startup cost calculator to estimate your total initial investment, including the $40,000 franchise fee and $150,000 in leasehold improvements. This tool simplifies calculating break-even point for a dessert shop franchise so you know exactly when your daily traffic starts generating real profit.

We integrated industry-standard unit economics for the dessert sector to help you sanity-check your numbers. By analyzing operating margins for frozen yogurt businesses, you can compare your $9,500 monthly rent and labor costs against typical benchmarks to ensure your store remains competitive and profitable.


Simply purchase and download the financial model template, then access it instantly using Microsoft Excel or Google Sheets. No installation or technical expertise required-just open and start working.

Enter your business-specific numbers, including revenue projections, costs, and investment details. The pre-built formulas will automatically calculate financial insights, saving you time and effort.

Leverage the investor-ready format to confidently showcase your financial projections to banks, franchise representatives, or investors. Impress stakeholders with clear, data-driven insights and professional reports.

Leverage the investor-ready format to confidently present your projections to banks, franchise representatives, or investors.