
All-in-one Dashboard
Core inputs and core outputs


This tool provides a complete Excel template for restaurant franchise cash flow forecasting, covering everything from initial build-out to five-year exit valuations.
Core inputs and core outputs
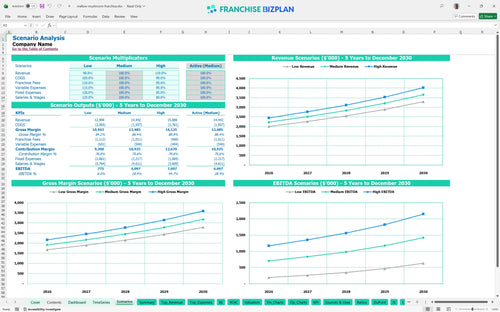
Three scenario analysis
Presentation ready
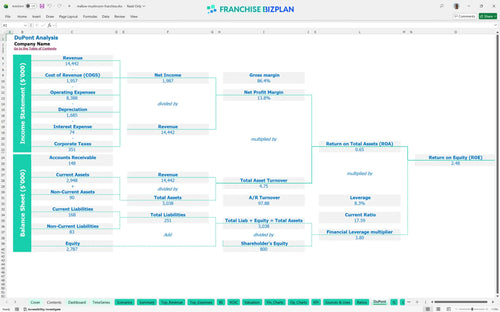
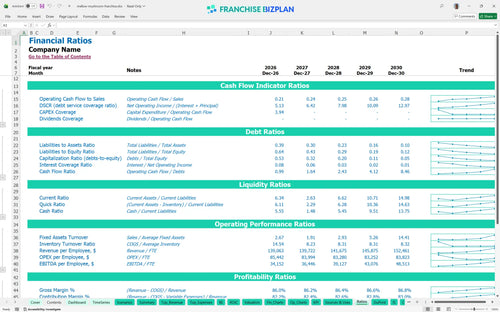
DuPont analysis
Researched revenue assumptions
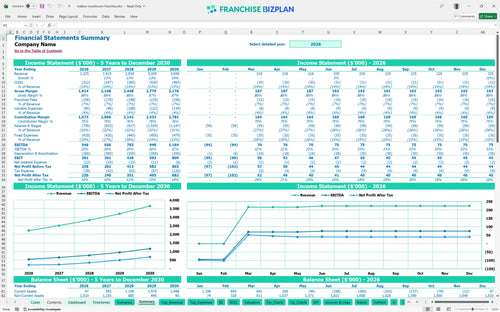
Lender-friendly financial outputs
Revenue stream detailed view
Performance metrics benchmark
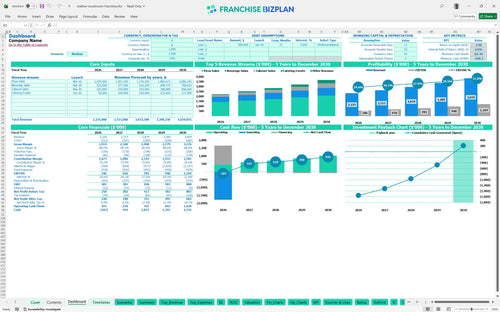
We built this franchise unit financial model using our own research to reflect the high-volume nature of a premium pizza concept. Key assumptions like the 5% royalty fee and $1.77M build-out are pre-populated and fully editable to match your specific Mueller district site. Here is the quick math: with Year 1 EBITDA at $546,000, you are looking at a fast 4-month operational break-even.
You can expect to hit the break-even date by April 2026, just four months after launching. While Year 1 EBITDA starts at $546,000, the real momentum builds by Year 5 as revenue climbs toward $3.65M.
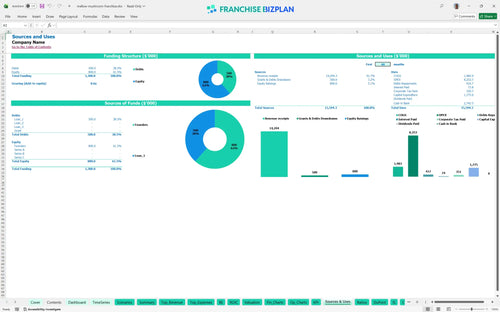
Launching this flagship unit requires a significant capital expenditure budget of approximately $1.775M. This covers the $50,000 franchise fee, heavy kitchen equipment, and the extensive leasehold improvements needed for a premium build-out.
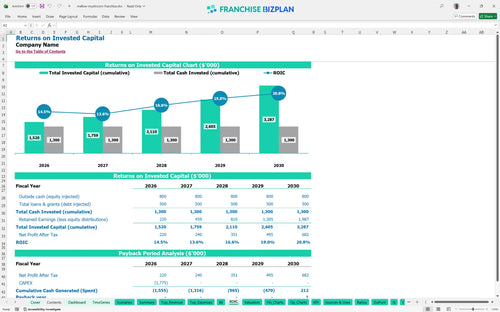
The restaurant franchise investment return calculator shows a 5-year payback period with an IRR of 2.57%. While the initial cash outlay is high, the steady climb in EBITDA suggests a stable long-term asset.
Analyzing break-even points for new restaurant franchises reveals you need to clear the $25,000 monthly rent and $42,000+ in base salaries quickly. The model targets month 4 for operational break-even, driven largely by high-volume pizza sales and beverage margins.
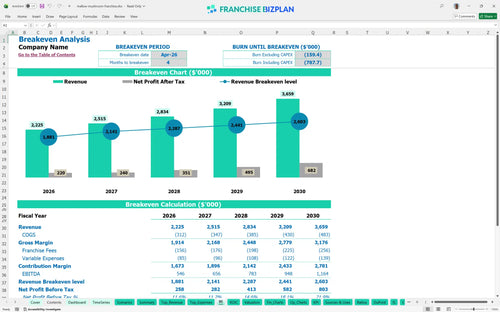
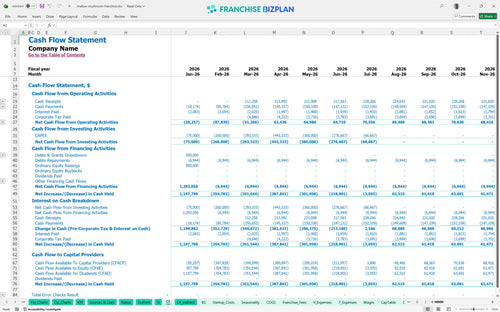
Your lowest cash point hits around July 2026 at -$420,000, reflecting the gap between opening costs and full revenue ramp-up. You'll defintely need a solid working capital buffer to navigate the first six months.
A financial model for multi-unit restaurant franchise expansion must account for volatility. Our high-case scenario assumes better catering penetration, while the low-case warns of slower ramp-up, which could push payback beyond year 5.
This Excel-based tool lets you swap out every variable to match your specific territory. You can adjust the pizza restaurant franchise financial feasibility study by toggling rent, local wages, or seasonal traffic. It's built so you can defintely test 'what-if' scenarios before signing a lease.

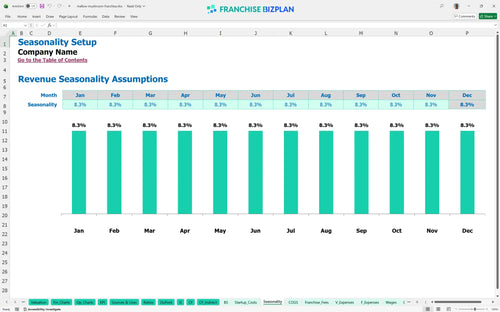
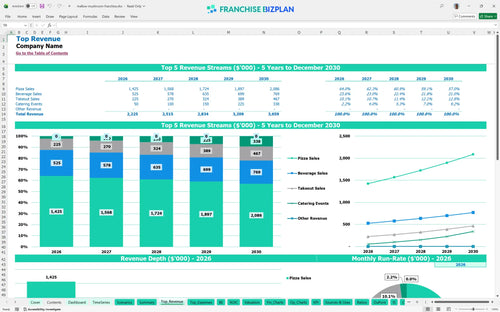
Mapping out five years of performance helps you see the transition from a new opening to a mature social hub. With revenue scaling from $2.22M in year one to over $3.6M by year five, the model tracks how margins expand as you optimize throughput. It's about seeing the long game for your pizza franchise financial model.

This model accounts for the 5% royalty and 2% marketing fee taken off the top of every dollar. At $2.5M in sales, that's $175,000 in annual fees before you even pay for cheese or labor. We make sure these franchise-specific costs are baked into your P&L statement template so there are no surprises.

You need to know exactly how to calculate startup costs for a pizza franchise to avoid running out of cash mid-build. With a total investment near $1.77M, including $800,000 for leasehold improvements, understanding your break-even is critical. The model shows you the exact sales volume needed to cover that $25,000 monthly rent and high-prime occupancy.

We use real-world benchmarks to ensure your estimating labor costs for casual dining franchise units stays realistic. If your kitchen labor or food cost percentage for pizza franchises drifts too far from the 12% target, the model flags it. It's a reality check against industry standards for high-volume, dual-service operations.


Simply purchase and download the financial model template, then access it instantly using Microsoft Excel or Google Sheets. No installation or technical expertise required-just open and start working.

Enter your business-specific numbers, including revenue projections, costs, and investment details. The pre-built formulas will automatically calculate financial insights, saving you time and effort.

Leverage the investor-ready format to confidently showcase your financial projections to banks, franchise representatives, or investors. Impress stakeholders with clear, data-driven insights and professional reports.

Leverage the investor-ready format to confidently present your projections to banks, franchise representatives, or investors.