
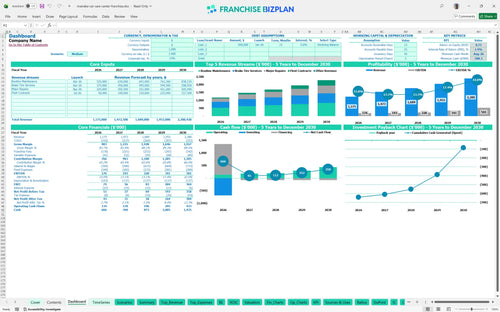
All-in-one Dashboard
Core inputs and core outputs


This franchise business financial projection Excel includes detailed revenue forecasting, a full staffing plan, CAPEX scheduling, and a complete 5-year pro forma for a car care center.
Core inputs and core outputs
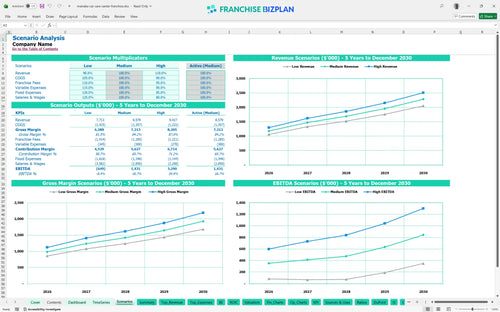
Three scenario analysis
Presentation ready
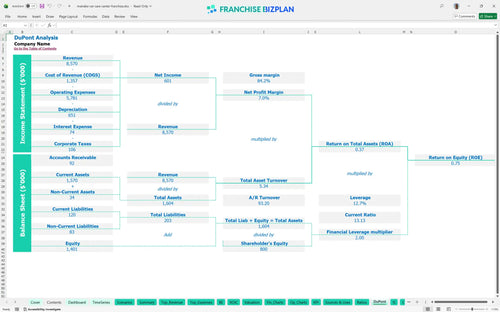
DuPont analysis
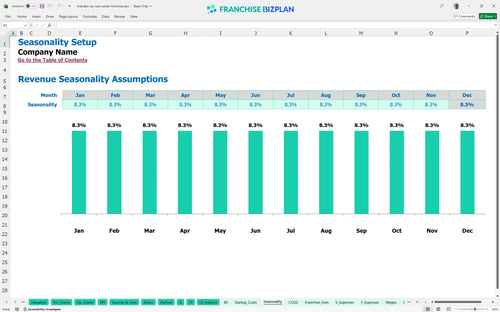
Researched revenue assumptions
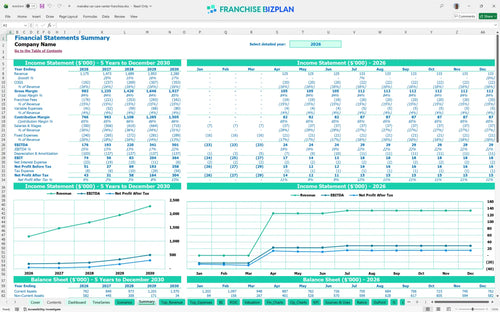
Lender-friendly financial outputs
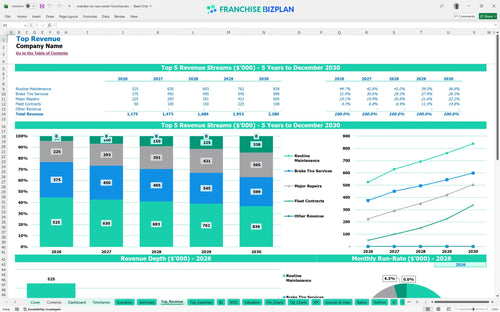
Revenue stream detailed view
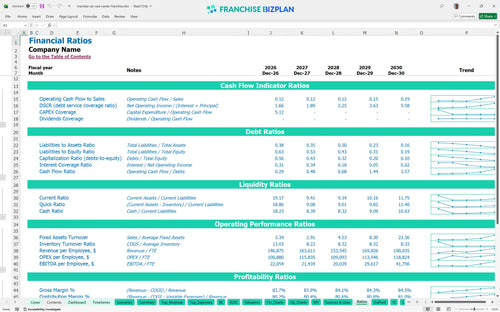
Performance metrics benchmark
We built this auto service center investment analysis using detailed research on unit-level performance and standard franchise requirements. The model includes pre-populated data for revenue streams like routine maintenance and fleet contracts, alongside fixed costs like the $13,000 monthly rent, all of which are fully editable to match your local market reality. Evaluating automotive franchise investment opportunity requires this level of store-level detail to ensure the payback math actually works.
This auto repair franchise financial model shows the unit reaching profitability by May 2026, just five months after the initial launch. Year 1 EBITDA starts at $176,000 and scales to $501,000 by Year 5 as you optimize the mix of major repairs and routine maintenance. Revenue stream forecasting is the key to maintaining this trajectory.
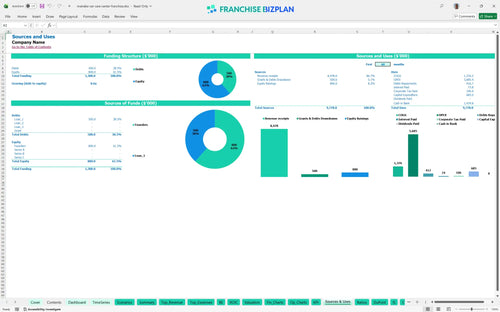
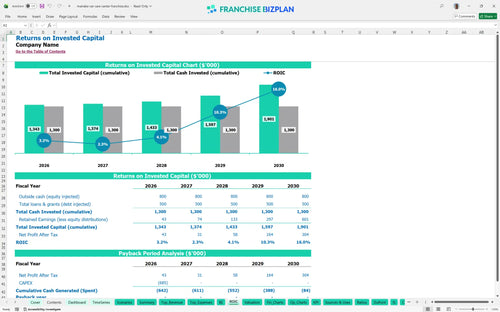
To launch this unit, you need an ROI calculation for car care center franchise that accounts for $588,000 in minimum cash. The capital is primarily used for $320,000 in leasehold improvements, $140,000 in automotive lifts, and the $45,000 initial franchise fee. Total startup costs must be covered before the first bay opens.
The automotive franchise unit profitability metrics indicate an Internal Rate of Return (IRR) of 1.88% and a Return on Equity (ROE) of 0.75%. While the unit generates strong annual EBITDA, the high initial investment means the payback period extends beyond the first five years of operation. Still, the long-term cash flow remains stable once the debt is serviced.
The monthly break-even point is reached in May 2026, driven by a year-one revenue target of $1.175 million. Reaching this milestone depends heavily on managing KPIs for managing an automotive service franchise, specifically the 15% combined royalty and marketing fee burden. Every ticket needs to contribute to the high $13,000 monthly rent.
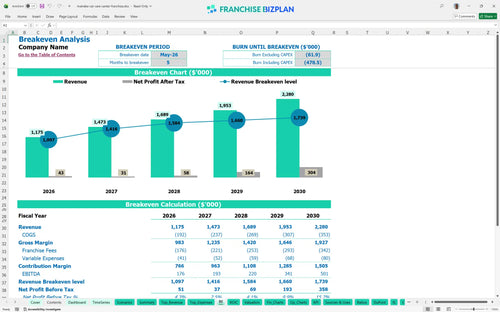
The lowest cash point occurs in August 2026, requiring a $588,000 liquidity buffer to survive the ramp-up phase. An operational cost analysis for auto service center shows that early payroll for the GM and Service Manager creates a cash burn that persists until the shop reaches full throughput. Franchise business operational expenses don't wait for your customers to show up.
The model allows for estimating recurring revenue for automotive franchise across low, medium, and high scenarios. While the medium case sees Year 2 revenue at $1.47 million, a high-performance scenario leverages fixed costs to significantly boost the 1.88% IRR and shorten the payback timeline. Local marketing execution is the variable that moves the needle most.
This auto repair franchise financial model is built in Excel with open formulas, letting you tweak every assumption from bay throughput to local labor rates. Whether you are adjusting for a specific Austin zip code or a different shop size, the editable inputs ensure the math reflects your specific territory. It functions as a financial model for independent auto repair center operators or franchise-specific owners alike.

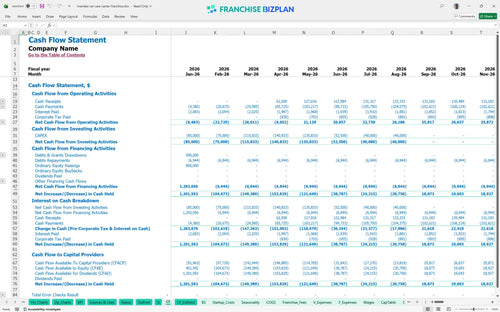
Planning for the long haul requires more than just a first-year guess. This Excel template for franchise financial forecasting provides a 60-month view of your cash flow and profitability, mapping the climb from a $1.17M year-one start to a $2.28M mature operation. Every 1-point margin leak matters fast in a single-unit model, so we track it for five years.

The model accounts for the 7% royalty and 8% marketing fee that come off the top of every ticket. By baking these franchise royalty fee breakdown details into the monthly franchise business plan financial spreadsheet, you can see exactly how brand fund contributions impact your store-level margin before you sign the agreement. Honestly, the 15% off-the-top burden is your biggest hurdle to clear.

Use the automotive franchise startup cost calculator to map out the $320,000 in leasehold improvements and $140,000 for automotive lifts. We track every dollar from the initial fee to the opening day buffer to find your franchise break-even analysis point. Knowing how to calculate startup costs for an auto repair franchise is the difference between a smooth launch and a mid-year cash crisis.

We include benchmarks for automotive repair shop P&L metrics like parts COGS (cost of goods sold) at roughly 14% and shop supplies at 1.8%. These numbers help you defintely know if your projected labor or occupancy costs are in line with high-performing units in the sector. If labor runs higher than 30%, your store-level EBITDA will get tight quickly.


Simply purchase and download the financial model template, then access it instantly using Microsoft Excel or Google Sheets. No installation or technical expertise required-just open and start working.

Enter your business-specific numbers, including revenue projections, costs, and investment details. The pre-built formulas will automatically calculate financial insights, saving you time and effort.

Leverage the investor-ready format to confidently showcase your financial projections to banks, franchise representatives, or investors. Impress stakeholders with clear, data-driven insights and professional reports.

Leverage the investor-ready format to confidently present your projections to banks, franchise representatives, or investors.