
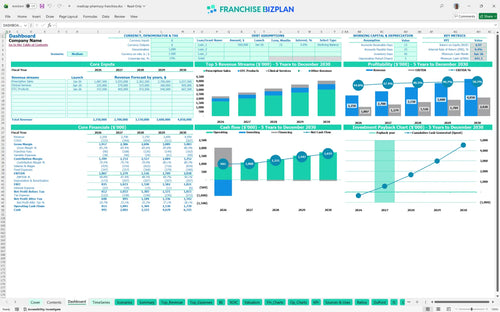
All-in-one Dashboard
Core inputs and core outputs


This pharmacy franchise financial model provides a complete pro forma toolkit including dynamic revenue drivers, capital expenditure planning, and detailed payroll forecasting for a new retail unit.
Core inputs and core outputs
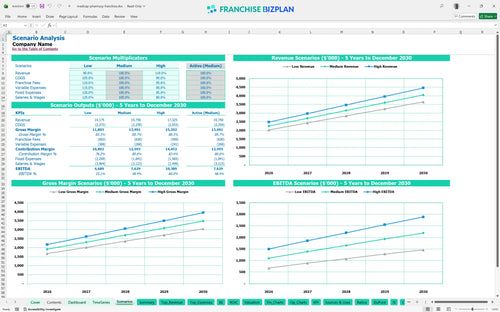
Three scenario analysis
Presentation ready
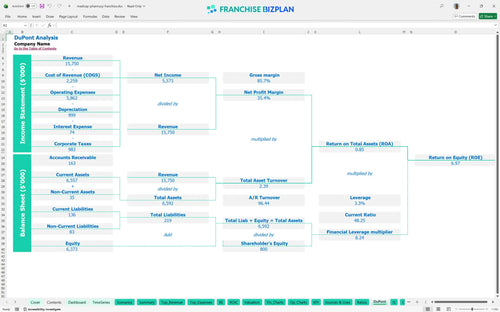
DuPont analysis
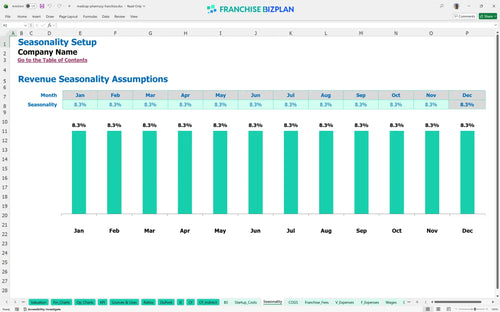
Researched revenue assumptions
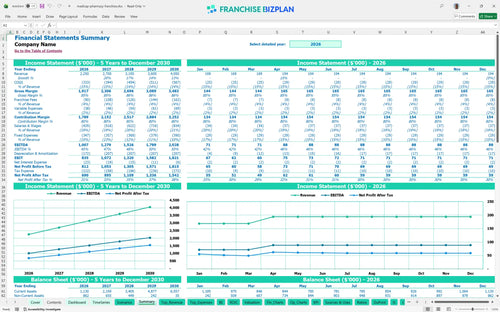
Lender-friendly financial outputs
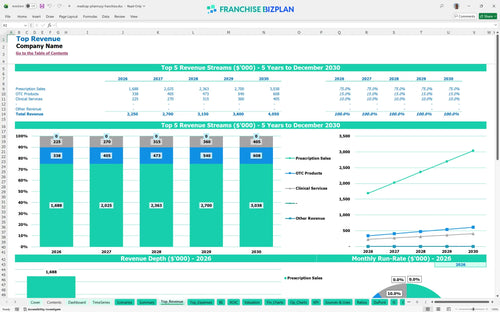
Revenue stream detailed view
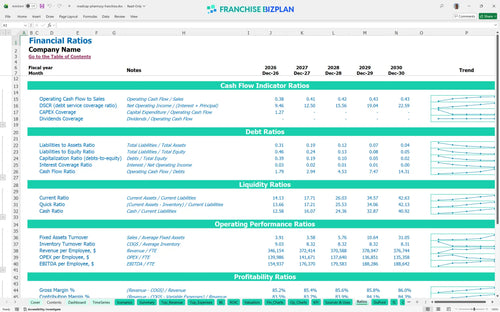
Performance metrics benchmark
We built this pharmacy franchise financial model using detailed research on unit-level economics and local demand drivers. Key assumptions, including the $2.25M initial revenue and $1,007,000 year-one EBITDA, are pre-populated with researched data and are fully editable to help you create a financial forecast for a new pharmacy unit.
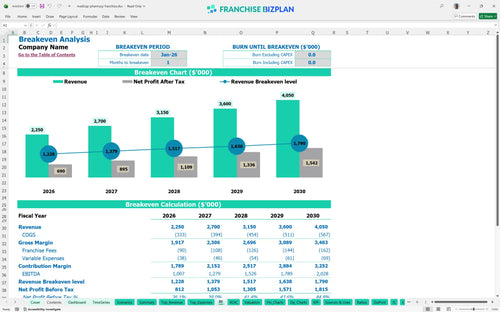
This pharmacy unit hits profitability almost immediately, reaching break-even by January 2026. By year one, you are looking at an EBITDA of $1,007,000 after accounting for drug costs, the 3% royalty, and professional salaries for the licensed pharmacist and manager.
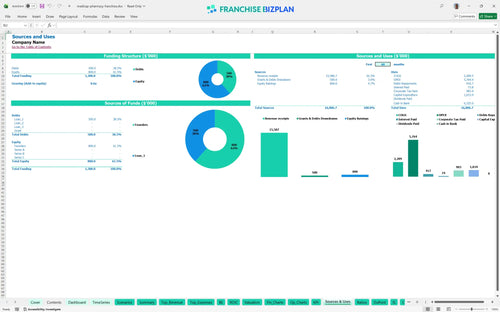
You need a significant startup budget template for retail pharmacy franchise success, with total capital exceeding $1M. This covers the $193,940 franchise fee, $350,000 for leasehold improvements, and $120,000 for specialized dispensing equipment to ensure brand standards are met.
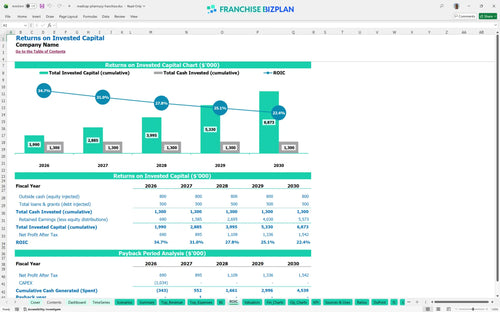
The pharmacy franchise ROI and profit margin analysis shows a 9.42% IRR and a 2-year payback period. With year-five EBITDA projected at $2,028,000, the long-term equity return remains steady at nearly 7% for a well-located unit.
You reach break-even in just one month, provided you hit the ground running with established referral networks. The primary driver for stability is maintaining high prescription volume to cover the $18,000 monthly rent and the $115,000 annual pharmacist salary.
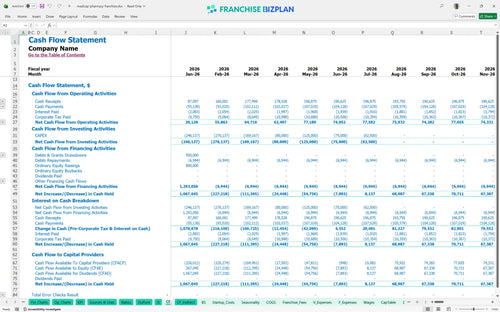
Your lowest cash point occurs in June 2026 at $641,000, which provides a comfortable buffer for a startup. Still, you should monitor the timing of the $110,000 consultation suite build-out to ensure working capital stays defintely positive during the initial ramp-up phase.
Evaluating pharmacy franchise business opportunities requires looking at Low, Medium, and High cases. A 10% drop in prescription volume significantly delays the 2-year payback, while the High case leverages clinical services to push year-1 margins toward the $1M EBITDA mark.
This pharmacy franchise financial model is fully customizable in Excel, allowing you to tweak every assumption from prescription volume to clinical service fees. Pre-filled formulas handle the heavy lifting so you can focus on local market adjustments and territory-specific pharmacy business plan template needs.

Plan your multi-year trajectory with detailed projections covering revenue, costs, and cash flow through 2030. At $2,250,000 in year-one sales scaling to over $4,000,000 by year five, this model tracks how your margins evolve as you scale clinical services and independent pharmacy financial projections.

Capture every dollar owed to the franchisor, including the 3% royalty and 1% marketing fund contribution. This ensures you see the true store-level EBITDA after the $193,940 initial fee and ongoing franchise royalty fees are paid out of your monthly pharmacy operational expenses.

Map out your total pharmacy franchise startup costs, from the $350,000 leasehold improvements to the $120,000 dispensing equipment. The model identifies the exact sales volume needed to cover your $18,000 monthly rent and specialized labor costs for healthcare business forecasting.

Compare your pharmacy franchise investment analysis against industry standards for labor and occupancy. With prescription drug costs starting at 12% of sales, the model helps you verify if your pharmacist and technician wages align with profitable retail pharmacy profitability ranges.


Simply purchase and download the financial model template, then access it instantly using Microsoft Excel or Google Sheets. No installation or technical expertise required-just open and start working.

Enter your business-specific numbers, including revenue projections, costs, and investment details. The pre-built formulas will automatically calculate financial insights, saving you time and effort.

Leverage the investor-ready format to confidently showcase your financial projections to banks, franchise representatives, or investors. Impress stakeholders with clear, data-driven insights and professional reports.

Leverage the investor-ready format to confidently present your projections to banks, franchise representatives, or investors.