
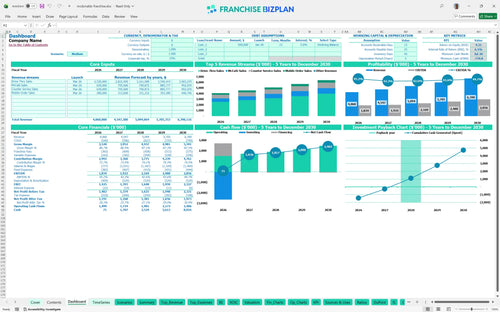
All-in-one Dashboard
Core inputs and core outputs


The franchise unit financial model template provides a comprehensive QSR financial forecasting tool with pre-built logic for 24-hour operations, drive-thru volume, and multi-channel revenue streams.
Core inputs and core outputs
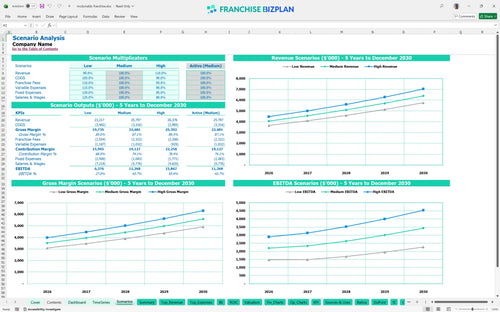
Three scenario analysis
Presentation ready
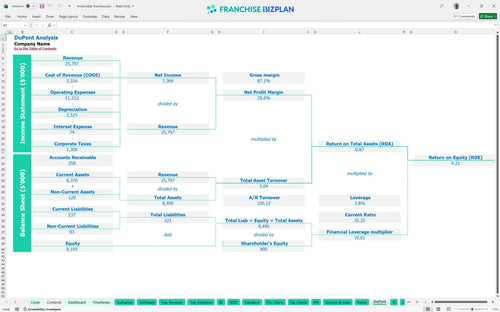
DuPont analysis
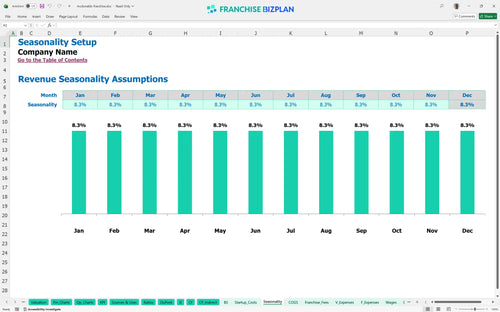
Researched revenue assumptions
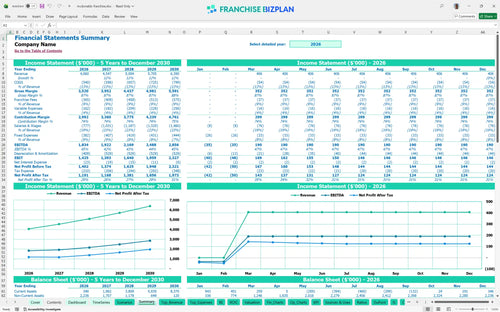
Lender-friendly financial outputs
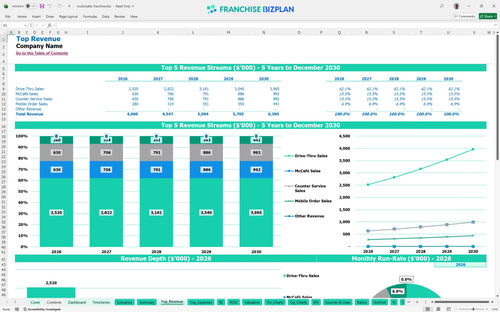
Revenue stream detailed view
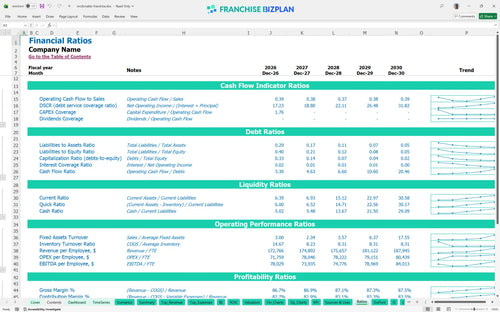
Performance metrics benchmark
We built this franchise unit financial model using our own research into high-volume QSR performance and site-level economics. Key assumptions, including the $1,834,000 Year 1 EBITDA and the $2.6M+ initial capital stack, are pre-populated and fully editable to match your specific location. This is a practical tool for operators who need to see the real-world impact of 24-hour labor and dual-lane drive-thru throughput.
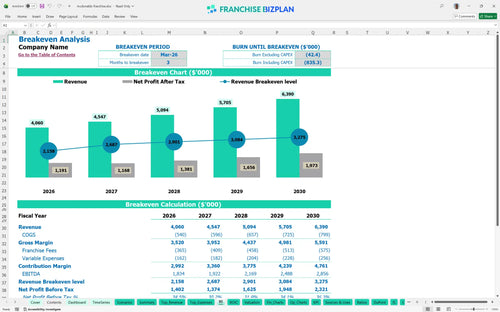
This franchise unit reaches profitability very quickly, hitting its break-even point in March 2026, just 3 months after opening. With Year 1 EBITDA projected at $1,834,000, the model shows strong early performance even after accounting for the 5% royalty and 4% marketing fund. Still, you must maintain high volume to offset the $22,000 monthly rent.
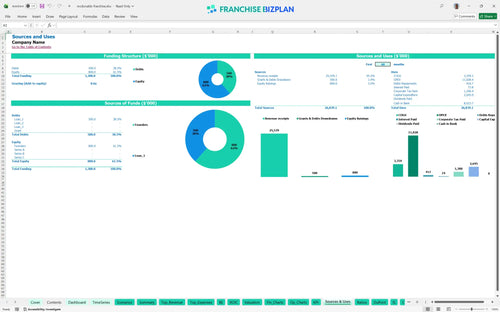
The total initial investment for this unit is approximately $2,645,000, which covers the $45,000 franchise fee, $1,200,000 in leasehold improvements, and $500,000 for kitchen equipment. You defintely need to account for the minimum cash dip of $735,000 that occurs in July 2026 during the ramp-up phase. Here is the quick math: your largest check goes toward the build-out and infrastructure.
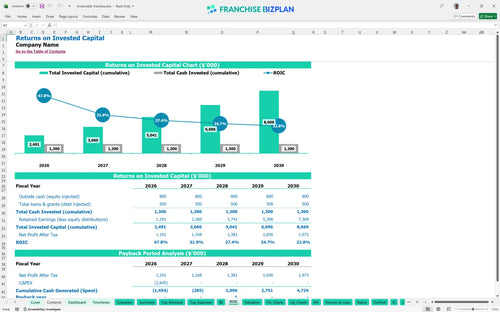
The restaurant franchise investment return calculator shows an Internal Rate of Return (IRR) of 6.07% and a Return on Equity (ROE) of 9.21%. Based on the unit economics modeling, you can expect a full payback of your initial capital within 3 years. What this estimate hides is that your ROI depends heavily on maintaining the projected $4M+ in annual revenue.
The monthly break-even occurs in month 3, driven by the high-volume nature of the 24-hour quick service restaurant model. The primary driver for reaching this point is drive-thru throughput, which accounts for over 40% of your total revenue. If your average ticket or traffic counts dip, the $22,000 fixed rent becomes a much heavier burden.
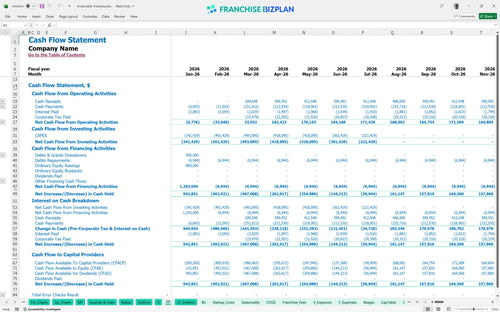
The lowest cash point is -$735,000 in July 2026, meaning you need significant liquidity beyond the initial build-out costs to survive the first year. This projected cash flow statement for the franchise unit suggests keeping a six-month buffer to handle utilities and the $85,000 GM salary during the early months. Cash is oxygen during a QSR launch.
In the high-growth scenario, Year 5 revenue reaches $6,390,000, which significantly improves the 6.07% IRR and shortens the 3-year payback. Low-volume scenarios, however, can delay the March 2026 break-even and increase the peak cash need. Analyzing revenue streams for this tech-forward franchise is the best way to prepare for market volatility.
Finance: update unit break-even and payback model by Friday.
This franchise financial model template is built in Excel with a focus on flexibility, allowing you to adjust every variable from drive-thru volume to local labor rates. All formulas are unlocked and pre-filled with researched data, so you can adapt the QSR financial forecasting tool to your specific territory or real estate site without starting from scratch. It is a plug-and-play resource for any serious operator.

Planning for a long-term exit or multi-unit expansion requires a clear view of the future, and this model delivers detailed 5-year projections for revenue, costs, and cash flow. You can track how scaling from Year 1 sales of $4,060,000 to Year 5 sales of $6,390,000 impacts your store-level margin and bottom-line stability. Long-term success in franchising is about seeing the curve before you hit it.

The model simplifies complex royalty fee calculation and brand fund contributions, ensuring you understand exactly how much goes to the franchisor every month. By inputting the 5% royalty and 4% marketing fee, you can see the immediate impact on your unit economics modeling before you ever sign the FDD (Franchise Disclosure Document). Knowing your true contribution margin is the only way to manage a profitable shop.

Estimating restaurant franchise startup costs is the most critical step for any new owner, and this tool covers everything from the $45,000 initial fee to the $1,200,000 leasehold improvements. It maps out your total investment and identifies the exact sales volume needed to cover your $22,000 monthly rent and fixed overhead. If you don't know your break-even, you don't know your risk.

We have integrated industry-standard benchmarks for labor, food costs, and occupancy to help you sanity-check your fast food franchise business plan. By comparing your projected 11.5% food cost against typical QSR operating expenses, you can identify margin leaks before they become expensive problems. Benchmarks turn a guess into a data-driven strategy.


Simply purchase and download the financial model template, then access it instantly using Microsoft Excel or Google Sheets. No installation or technical expertise required-just open and start working.

Enter your business-specific numbers, including revenue projections, costs, and investment details. The pre-built formulas will automatically calculate financial insights, saving you time and effort.

Leverage the investor-ready format to confidently showcase your financial projections to banks, franchise representatives, or investors. Impress stakeholders with clear, data-driven insights and professional reports.

Leverage the investor-ready format to confidently present your projections to banks, franchise representatives, or investors.