
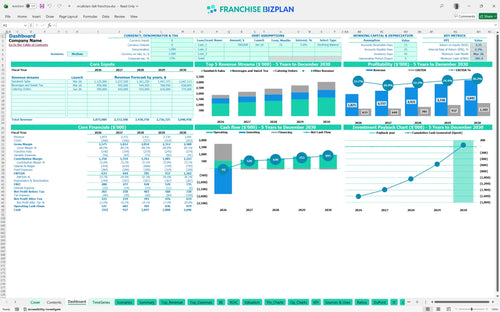
All-in-one Dashboard
Core inputs and core outputs


This financial feasibility study for food service franchise includes detailed revenue streams, a full CAPEX schedule, and a 60-month cash flow projection to ensure your unit remains solvent during the ramp-up phase.
Core inputs and core outputs
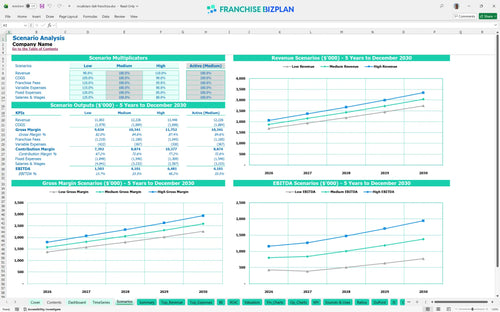
Three scenario analysis
Presentation ready
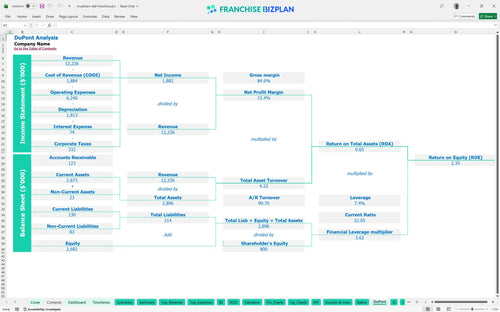
DuPont analysis
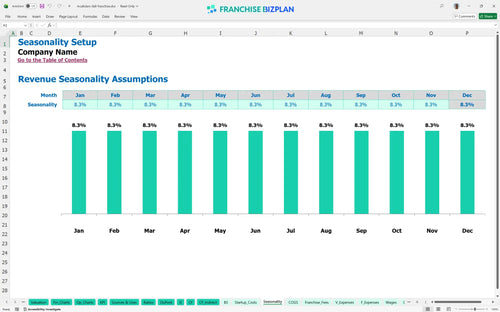
Researched revenue assumptions
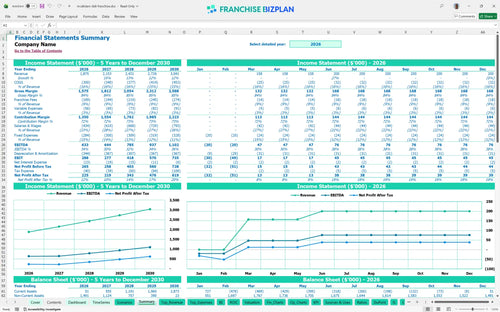
Lender-friendly financial outputs
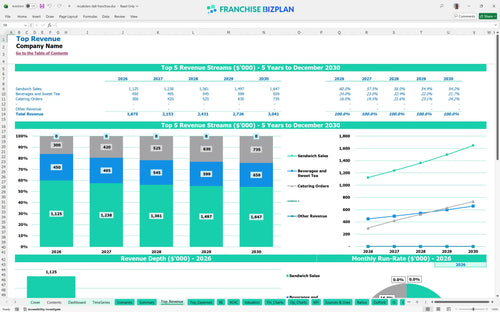
Revenue stream detailed view
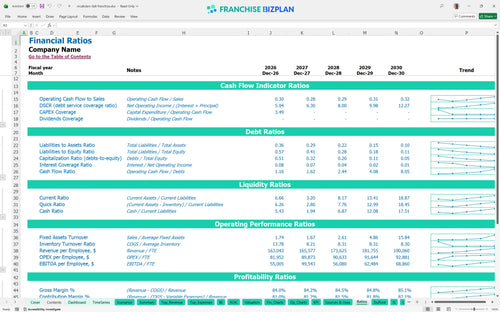
Performance metrics benchmark
We built this franchise unit financial model using our own research into the quick-casual sandwich sector. Key assumptions, including the $1.8M+ year-one revenue and the $18,000 monthly rent for prime locations, are pre-populated and fully editable to fit your specific site. This model helps you navigate the $1.83 million initial investment with confidence and precision.
The unit hits positive EBITDA of $633,000 in its first year, but true net profitability depends on clearing your initial $1.83 million investment. You can expect the unit to be cash-flow positive almost immediately after the three-month ramp-up period. Profitability starts when your systems outpace your overhead.
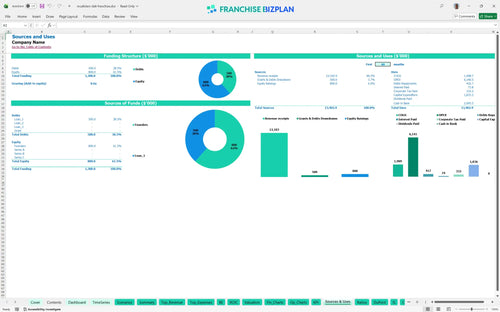
You will need approximately $1,835,500 to launch this unit, covering everything from the $35,500 franchise fee to the $800,000 leasehold build-out. This includes specialized costs like the $150,000 express pickup window and $100,000 for curbside stations. Capital is the fuel; make sure you don't have a leak.
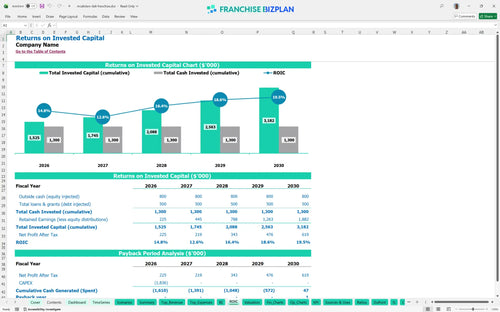
Investors should look at the 2.35% IRR and the 5-year payback period as the primary benchmarks for this high-volume sandwich shop. While the initial cash outlay is significant, the year-5 EBITDA of $1,102,000 demonstrates strong long-term cash generation. Returns take time, so patience is a line item.
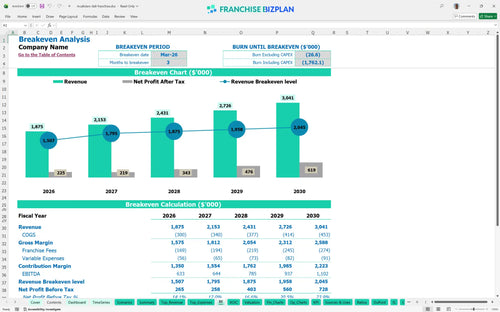
The unit is projected to reach its break-even point in March 2026, just three months after the initial launch. Your ability to hit this depends heavily on sandwich volume and managing the $18,000 monthly rent. Speed to break-even is the best metric for survival.
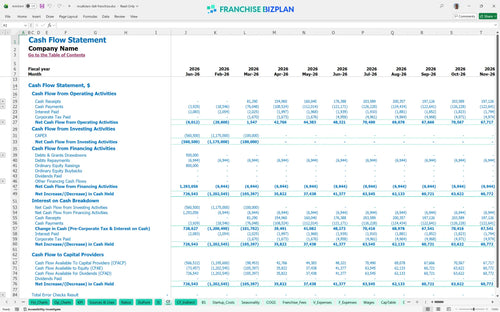
The lowest cash balance occurs in March 2026, reaching a deficit of $581,000 during the final stages of the build-out and initial opening. You defintely need to ensure your financing covers this gap plus a 10% buffer for unexpected construction delays. Cash is oxygen; don't hold your breath too long.
Analyzing profitability of high-volume sandwich shop scenarios shows that a 10% drop in sandwich sales can delay your payback period by over 12 months. Conversely, hitting the high-growth scenario with strong corporate catering can push year-5 revenue well beyond the $3 million mark. Plan for the worst, but build for the best.
This Excel template for franchise unit financial planning allows you to swap out every variable to match your specific territory and local market conditions. You get a franchise financial model template with pre-built formulas for sandwich sales, catering, and beverage volume, so you can test different pricing and traffic assumptions without breaking the logic. Control your numbers before they control you.

Plan your growth with a quick-casual restaurant financial projection that tracks your performance from the grand opening through year five. The model scales from an initial $1.87 million in annual sales to over $3 million, helping you visualize how store-level margins shift as your team hits its stride. Five years of foresight beats five months of guessing.

This tool simplifies budgeting for franchise marketing and local advertising by automating the 5% royalty and 4% marketing fund calculations. You can see exactly how much of your $1,875,000 first-year revenue goes to the franchisor and how much stays in your pocket after all brand obligations are met. Royalties are a fixed reality, not a variable suggestion.

Learn how to calculate startup costs for a restaurant franchise by totaling leasehold improvements, kitchen gear, and the initial fee before you sign a lease. This franchise unit startup costs tracker helps you identify the exact sales volume needed to cover your $18,000 monthly rent and labor expenses. Knowing your break-even is the difference between a business and a hobby.

Use our integrated operating expenses breakdown to compare your food costs and labor spend against standard quick-casual performance. With food ingredients starting at 14% and scaling down to 12.9%, the model helps you spot margin leaks in your sandwich shop operations early. Benchmarks keep your assumptions from floating into fantasy.


Simply purchase and download the financial model template, then access it instantly using Microsoft Excel or Google Sheets. No installation or technical expertise required-just open and start working.

Enter your business-specific numbers, including revenue projections, costs, and investment details. The pre-built formulas will automatically calculate financial insights, saving you time and effort.

Leverage the investor-ready format to confidently showcase your financial projections to banks, franchise representatives, or investors. Impress stakeholders with clear, data-driven insights and professional reports.

Leverage the investor-ready format to confidently present your projections to banks, franchise representatives, or investors.