
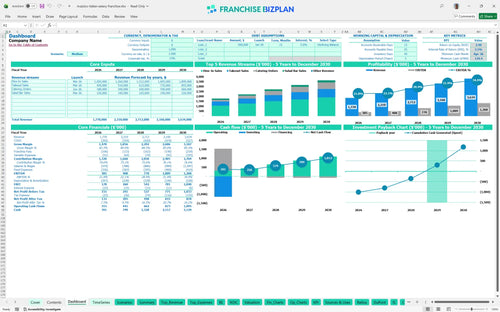
All-in-one Dashboard
Core inputs and core outputs


This franchise unit financial model for new owners provides a detailed, Excel-based roadmap covering startup costs, five-year revenue streams, and unit economics to ensure your investment is backed by data.
Core inputs and core outputs
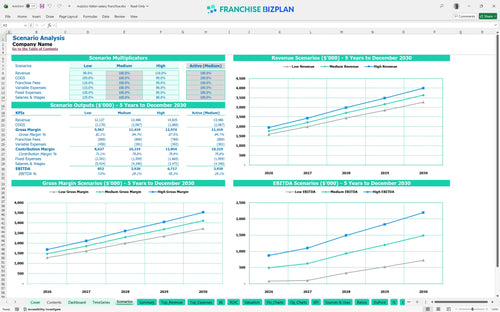
Three scenario analysis
Presentation ready
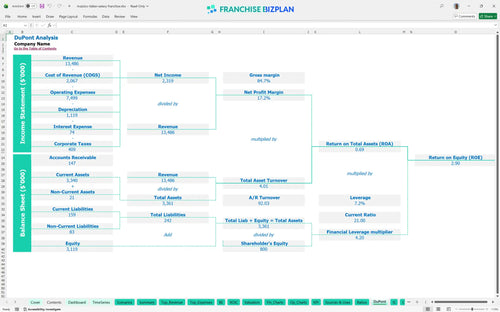
DuPont analysis
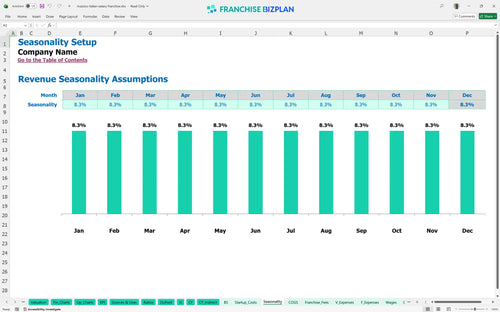
Researched revenue assumptions
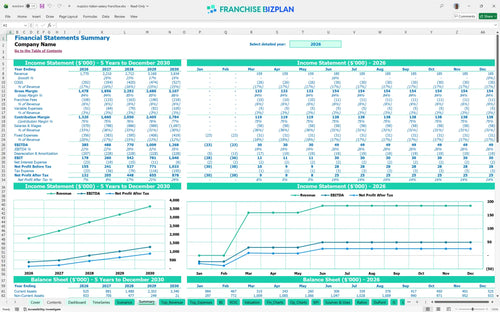
Lender-friendly financial outputs
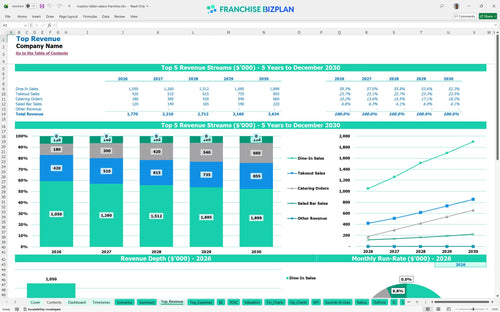
Revenue stream detailed view
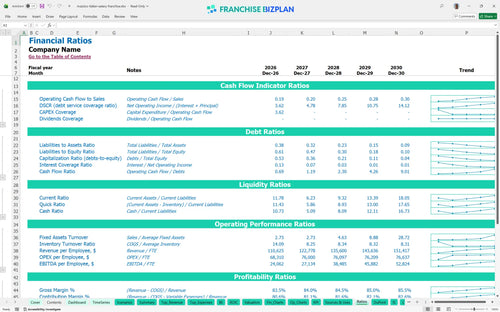
Performance metrics benchmark
We built this franchise unit financial model using our own research to ensure it reflects real-world operations. Key assumptions like the $1.77M year-one revenue and $1.14M in capital expenditures (CAPEX) are pre-populated for a Mazzio's Italian Eatery Franchise unit but remain fully editable. This tool helps you see how the $20,000 monthly rent and 5% royalty fees impact your bottom line.
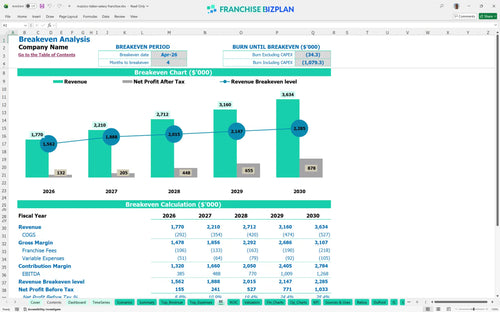
This unit becomes profitable in its first year, hitting the break-even point by April 2026. After accounting for food costs, the 5% royalty, and the 1% marketing fund, EBITDA (Earnings Before Interest, Taxes, Depreciation, and Amortization) is projected to reach $385,000 in Year 1. Still, you must learn how to forecast catering revenue for restaurants to hit the $120,000 catering target in the first year.
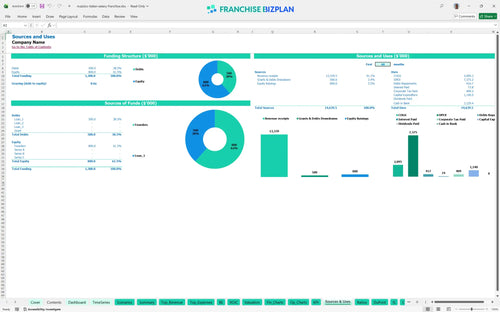
Launching this unit in the US requires $1,140,000 in total initial investment. This includes the $20,000 franchise fee, $500,000 for leasehold improvements, and $220,000 for kitchen equipment. You also need a $124,000 cash buffer to cover the ramp-up period until the unit reaches its lowest cash point in April 2026. To be fair, a high-visibility end-cap location is expensive but drives the necessary volume.
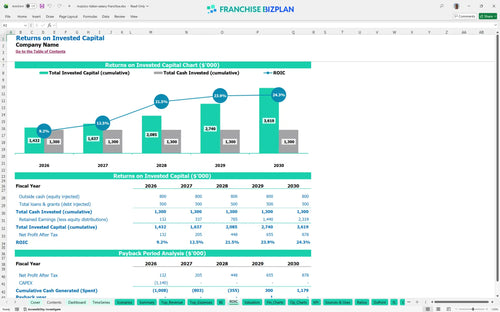
The model shows an Internal Rate of Return (IRR) of 3.54% and a Return on Equity (ROE) of 2.9. While the percentage returns seem conservative, the cash flow is strong, with a payback period of 4 years. This means you recoup your initial million-dollar investment by the end of year four. It is a solid long-term play if you can manage the high labor costs of a full-service kitchen.
The monthly break-even occurs in April 2026, just four months after the January start. The biggest driver for this is the $20,000 monthly rent and the $294,000 annual server payroll. Best practices for restaurant franchise financial forecasting suggest that hitting your $700,000 year-one dine-in goal is the only way to cover these high fixed costs. Plus, the 6% combined royalty and ad fund adds constant pressure.
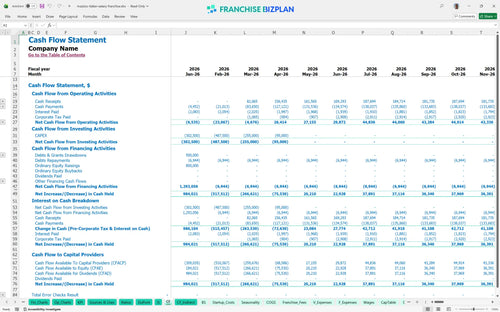
Your lowest cash point is April 2026, where the balance dips to $124,000. You have enough runway for the four-month ramp-up, but any construction delay will burn through that buffer quickly. Honestly, keeping an extra 10% in working capital is defintely a smart move for any new owner. Still, the $1.77M in year-one revenue provides a healthy cushion once the doors stay open.
Analyzing franchise unit economics and profit margins shows that a 'High' scenario, driven by strong corporate catering, could shorten payback to 3 years. However, the 'Low' case warns that if food costs rise above 14.5% or labor isn't managed, the peak cash need could exceed your $124,000 buffer. This is why financial modeling for multi-unit restaurant growth is essential before expanding beyond your first location.
Finance: update unit break-even and payback model by Friday.
This franchise financial model template is built in Excel, so you can swap out any assumption without breaking the logic. Whether you are adjusting for a specific zip code or a unique building footprint, the pre-filled formulas handle the heavy lifting. It is a flexible tool for a restaurant franchise business plan that lets you test different 'what-if' scenarios before signing a lease.

You need to see past the first year to understand if the ROI analysis (Return on Investment) actually makes sense. This model provides 5-year franchise unit financial projections, mapping out everything from initial ramp-up to mature-store performance. It uses an Excel template for restaurant franchise financial planning to cover your full P&L (Profit and Loss), balance sheet, and cash flow forecasting.

Royalties and marketing funds are the franchise obligations that can eat your store-level margin if you aren't careful. The model calculates these based on gross sales, accounting for the 5% royalty and 1% brand fund seen in the data. By automating these calculations, you get a clear view of your actual contribution margin after the franchisor takes their cut.

Estimating profitability for fast-casual dining franchises starts with a realistic startup cost breakdown for an Italian restaurant franchise. We've mapped out the $20,000 franchise fee, $500,000 in leasehold improvements, and $220,000 for pizza ovens. This franchise startup cost calculator helps you pinpoint the exact month your sales cover both fixed and variable costs. Use it to learn how to calculate startup costs for a restaurant franchise accurately.

Don't guess on your restaurant franchise operating expense budget template. We include built-in benchmarks for labor, food costs (COGS), and rent to help you see if your projections are realistic. For example, if your food ingredients are hitting 14.5% but the industry average is higher, you'll know to double-check your waste. This restaurant profitability analysis excel tool keeps your expectations grounded in reality.


Simply purchase and download the financial model template, then access it instantly using Microsoft Excel or Google Sheets. No installation or technical expertise required-just open and start working.

Enter your business-specific numbers, including revenue projections, costs, and investment details. The pre-built formulas will automatically calculate financial insights, saving you time and effort.

Leverage the investor-ready format to confidently showcase your financial projections to banks, franchise representatives, or investors. Impress stakeholders with clear, data-driven insights and professional reports.

Leverage the investor-ready format to confidently present your projections to banks, franchise representatives, or investors.