
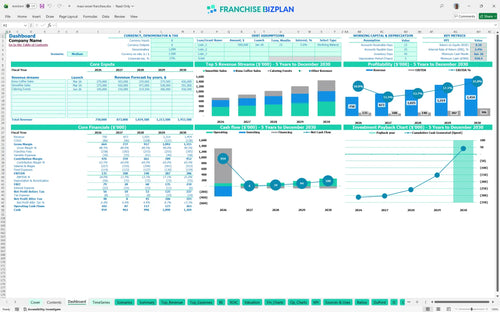
All-in-one Dashboard
Core inputs and core outputs


This franchise financial model for small business owners provides a comprehensive toolkit for projecting revenue, managing expenses, and calculating the total return on a single-unit investment.
Core inputs and core outputs
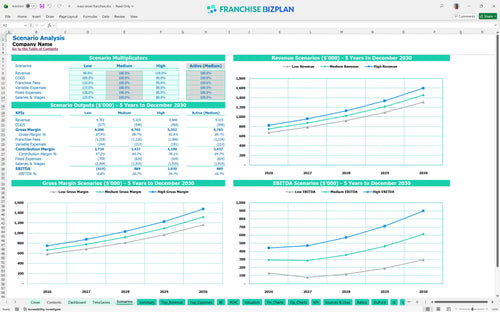
Three scenario analysis
Presentation ready
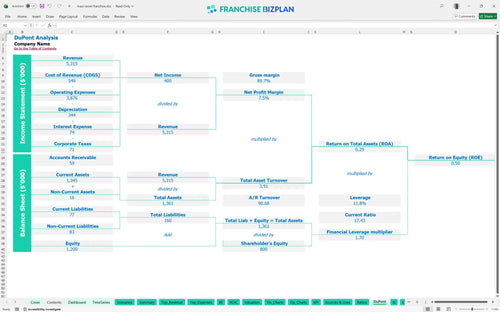
DuPont analysis
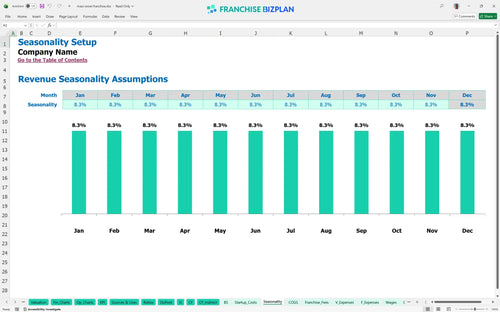
Researched revenue assumptions
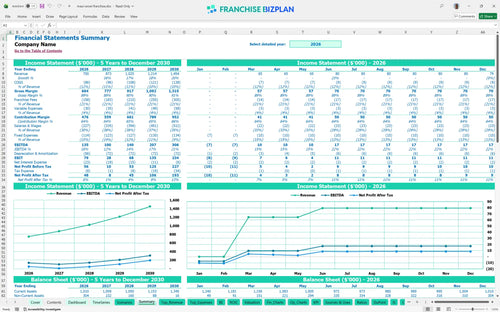
Lender-friendly financial outputs
Revenue stream detailed view
Performance metrics benchmark
We built this unit economics analysis using research-based assumptions for a beverage and catering concept, including a $750,000 year-one revenue target and a $30,000 initial fee. All inputs for estimating profitability for a mobile catering franchise are pre-populated and fully editable, allowing you to adjust for your specific local labor rates and lease terms.
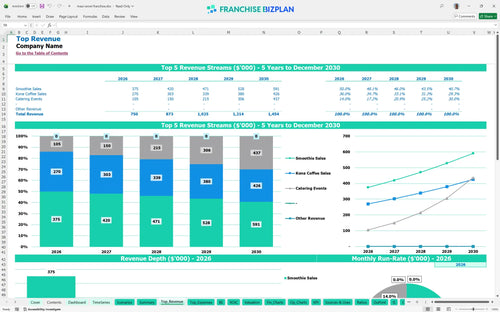
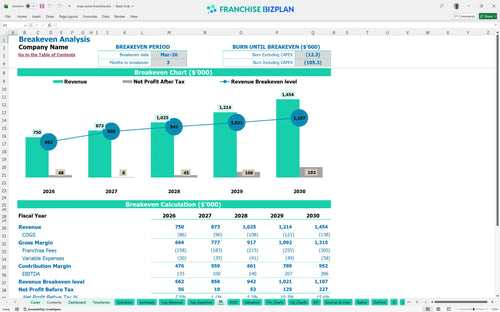
This unit reaches operational profitability by March 2026, just three months after launching. Here's the quick math: with year-one EBITDA projected at $135,000, the model shows a fast ramp-up, but you must maintain high traffic to offset the 15% marketing fee. This franchise profitability analysis suggests that early focus on high-margin smoothie sales is critical for staying in the black.
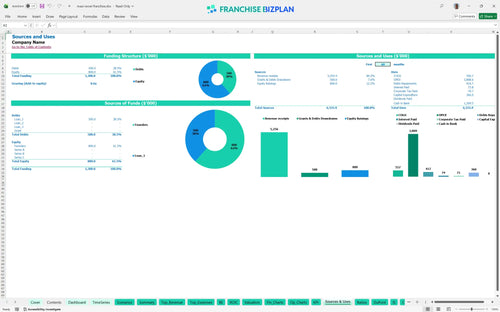
Launching this unit requires a total franchise investment breakdown of approximately $360,000 in upfront capital. This includes $120,000 for leasehold improvements and $90,000 for the mobile catering unit, which serves as a secondary revenue stream. The model accounts for these as major cash outlays before your March opening date.
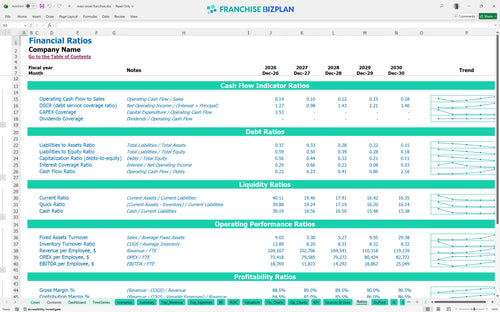
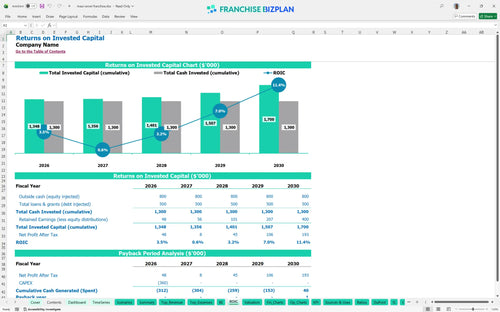
The model projects an Internal Rate of Return (IRR) of 2.43% and a 5-year payback period on your initial investment. While the ROE of 0.5 shows steady equity growth, calculating ROI for a quick service restaurant franchise like this requires looking at the total 5-year cash flow, which reaches $306,000 in annual EBITDA by year five. Still, the low IRR means you must execute perfectly on the catering side to justify the risk.
You hit the break-even point in month 3, but your monthly fixed costs of $9,300-including a $6,000 lease-require consistent daily volume. A financial feasibility study for franchise expansion shows that labor is your biggest variable lever; if crew member hours exceed the 3.5 FTE plan, your break-even revenue requirement climbs significantly. Plus, the 6% royalty fee is a permanent drag on your daily contribution margin.
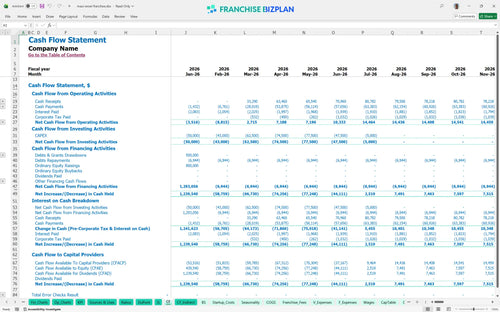
Your franchise cash flow projection spreadsheet shows the lowest cash point in June 2026 at $918,000, assuming you maintain a significant liquidity reserve. This estimate hides the potential for construction delays, which could defintely push your opening back and increase pre-opening burn. You need enough runway to cover the $58,000 manager salary before the catering revenue kicks in fully in June.
Using this small business financial projection model, you can see that a 10% drop in smoothie sales pushes your payback period well beyond 5 years. In the high-growth scenario, where catering events hit $291,000 by year five, your EBITDA margins expand significantly due to operating leverage on fixed costs like insurance and the park lease. Operating expense forecasting is the difference between a struggling unit and a high-performer.
This franchise financial model template is built on a fully customizable Excel architecture, allowing you to swap out default assumptions for your specific territory reality. You can adjust pre-filled formulas for revenue and pricing drivers to see how different volume levels impact your bottom line. It is designed to be an Excel template for franchise unit financial planning that adapts as your local market conditions change.

Creating a 5-year financial forecast for a new franchise is essential for securing lending and mapping out your growth. This model provides a detailed 5-year franchise revenue projection and expense outlook, including a full balance sheet and cash flow view. It helps you move beyond year-one survival to analyze long-term profitability and sustainable unit growth.

The model accurately captures your franchise royalty fee structure and brand fund obligations to ensure you see the true net margin. By integrating the initial franchise fee and ongoing marketing contributions into your franchise business plan template, you can track how these corporate costs eat into store-level EBITDA. This transparency is vital for understanding your total financial commitment to the brand.

Use this franchise startup cost calculator to determine exactly how much liquidity you need before serving your first customer. The model includes a detailed break-even analysis that calculates the sales volume required to cover your $6,000 monthly rent and other fixed costs. It's a practical way to learn how to calculate startup costs for a coffee franchise while managing your initial capital buffer.

This tool allows for analyzing franchise unit operating margins against built-in industry standards to ensure your projections are realistic. By following best practices for franchise unit budget management, you can compare your labor and occupancy costs to typical ranges for quick-service concepts. This sanity-check feature helps you identify if your staffing plan or rent-to-sales ratio is out of alignment.


Simply purchase and download the financial model template, then access it instantly using Microsoft Excel or Google Sheets. No installation or technical expertise required-just open and start working.

Enter your business-specific numbers, including revenue projections, costs, and investment details. The pre-built formulas will automatically calculate financial insights, saving you time and effort.

Leverage the investor-ready format to confidently showcase your financial projections to banks, franchise representatives, or investors. Impress stakeholders with clear, data-driven insights and professional reports.

Leverage the investor-ready format to confidently present your projections to banks, franchise representatives, or investors.