
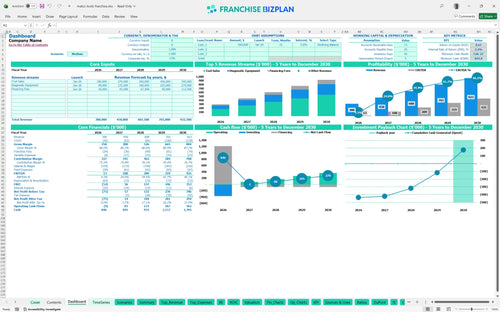
All-in-one Dashboard
Core inputs and core outputs


This mobile tool franchise business plan includes an Excel template for mobile franchise unit financial forecasting with 5-year projections, startup cost tracking, and detailed tool truck franchise profitability analysis.
Core inputs and core outputs
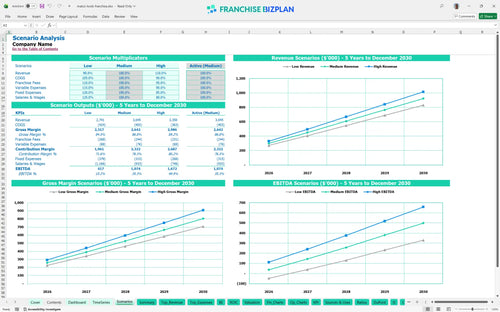
Three scenario analysis
Presentation ready
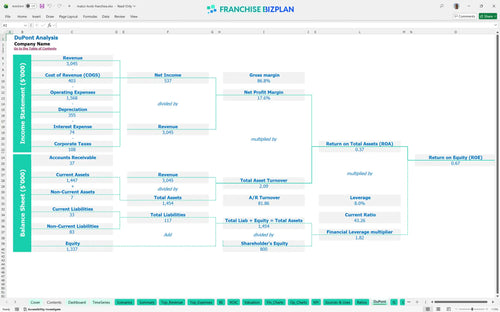
DuPont analysis
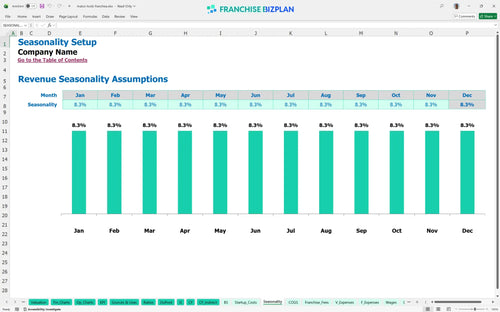
Researched revenue assumptions
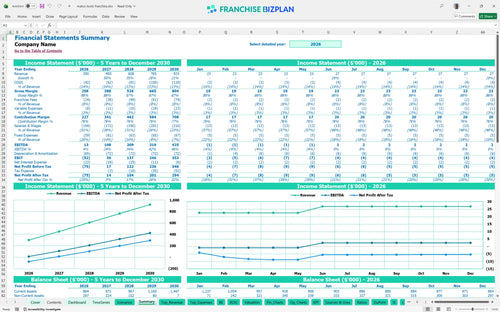
Lender-friendly financial outputs
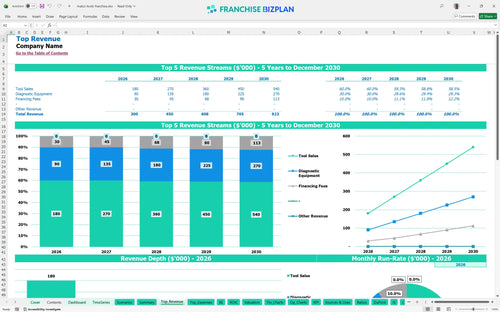
Revenue stream detailed view
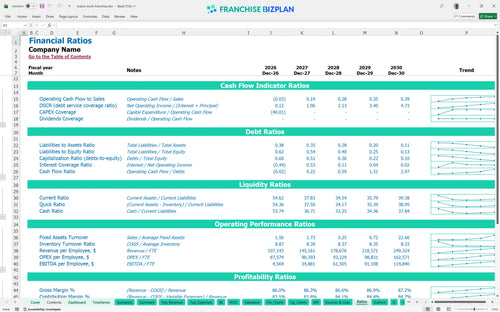
Performance metrics benchmark
We built this franchise unit financial model using our own research to provide a financial planning guide for mobile franchise owners. Key assumptions like revenue streams, operating expenses, and the 8% royalty fee are pre-populated with researched data specific to this mobile tool franchise unit and are fully editable. With a year-five EBITDA of $425,000 and a 5-year payback, this tool provides a realistic look at the numbers. Data-driven planning beats gut feeling every time.
This franchise unit becomes profitable in its first year, generating a $13,000 EBITDA as you establish your route. By year three, profitability analysis for tool route franchise business shows EBITDA climbing to $209,000 as you deepen relationships with local shops. Profitability depends on maintaining a steady inventory turnover ratio while managing the 8% royalty burden.
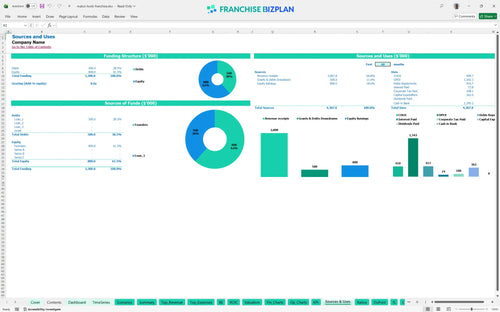
Launching this unit requires significant startup capital requirements for tool truck business, including a $150,000 mobile showroom vehicle and $100,000 in initial inventory. The total investment also covers a $10,000 franchise fee and $30,000 for demo equipment. You must also account for the minimum cash requirement of $842,000 to handle the ramp-up phase. Knowing where every dollar goes prevents mid-launch panics.
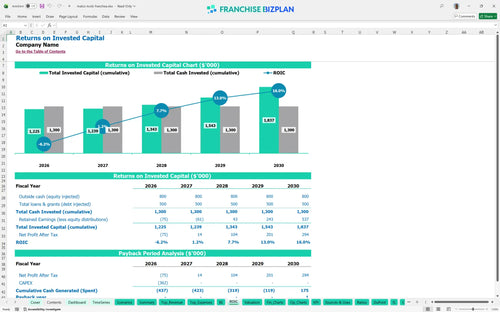
Analyzing franchise unit ROI for automotive tools shows an Internal Rate of Return (IRR) of 2.25% and a Return on Equity (ROE) of 0.67. The payback period is estimated at 5 years, which is typical for a capital-intensive mobile showroom franchise operating cost spreadsheet. By year five, you are looking at a strong EBITDA of $425,000. Real ROI takes time and consistent route execution.
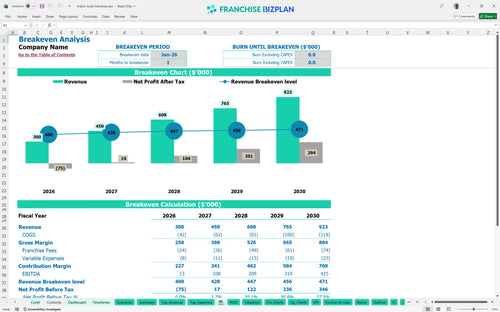
The unit reaches its break-even point in January 2026, just one month after launch, due to immediate demand in high-density automotive corridors. This assumes you hit your initial tool sales targets and manage the $2,500 monthly vehicle lease effectively. Speed to break-even determines your ultimate survival in this competitive market.
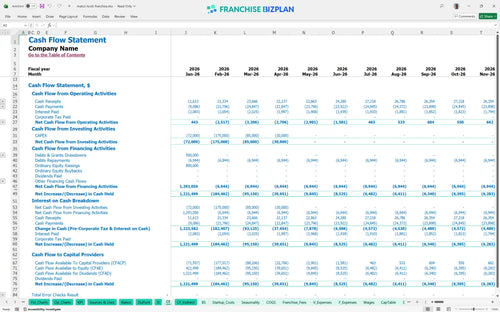
The lowest cash point occurs in February 2027 at $842,000, which is when you must be most careful about how to project cash flow for a mobile tool business. You will need to balance payroll for your sales rep and service tech against your inventory needs. Cash is king when you are stocking a mobile showroom and managing a growing route.
Financial modeling for automotive franchise opportunities shows that a high-growth scenario targeting racing shops can pull your payback period in significantly. In the medium case, year-1 EBITDA is $13,000, but a low scenario with poor route optimization could see that margin disappear. Planning for the worst helps you achieve the best results.
Finance: update unit break-even and payback model by Friday.
This franchise financial model template is built in Excel with fully editable formulas, allowing you to customize every detail of your mobile retail operation. You can swap out pre-filled assumptions for tool sales or vehicle costs to match your specific territory and route needs. It makes it easy to test different scenarios like higher fuel costs or varied inventory levels without breaking the math. Every cell is open for your specific route data.

Planning for the long haul is vital when you are managing a mobile showroom and recurring revenue forecasting. This model provides a detailed 5-year view of your revenue, expenses, and cash flow to help you see the path from startup to a mature route. It defintely helps you track how increasing diagnostic equipment sales impact your bottom line as you scale. Long-term visibility is the best defense against surprise costs.

Operating a mobile retail franchise involves specific financial commitments like a franchise royalty fee calculation based on 8% of sales. This tool tracks those ongoing costs alongside the initial $10,000 franchise fee so you know exactly what stays in your pocket. We have mapped out how these obligations scale with your weekly tool sales and financing fees. Know exactly what the franchisor takes before you pay yourself.

Getting your truck on the road requires a clear franchise startup cost analysis, including the $150,000 mobile showroom vehicle. This model helps you find your break-even point by comparing fixed costs like vehicle leases against your gross margins. You will see exactly how many tool kits you need to sell to cover your monthly nut. Your break-even point is the most important number in the sheet.

We have baked in industry standards for mobile retail operating expenses to help you sanity-check your numbers against real-world performance. Whether it is fuel maintenance at 1% of sales or labor costs for a sales rep, these benchmarks show if your route is running lean or heavy. It is a reality check to ensure your projections stay grounded in the automotive tool world. Don't fly blind when you can use proven industry standards.


Simply purchase and download the financial model template, then access it instantly using Microsoft Excel or Google Sheets. No installation or technical expertise required-just open and start working.

Enter your business-specific numbers, including revenue projections, costs, and investment details. The pre-built formulas will automatically calculate financial insights, saving you time and effort.

Leverage the investor-ready format to confidently showcase your financial projections to banks, franchise representatives, or investors. Impress stakeholders with clear, data-driven insights and professional reports.

Leverage the investor-ready format to confidently present your projections to banks, franchise representatives, or investors.