


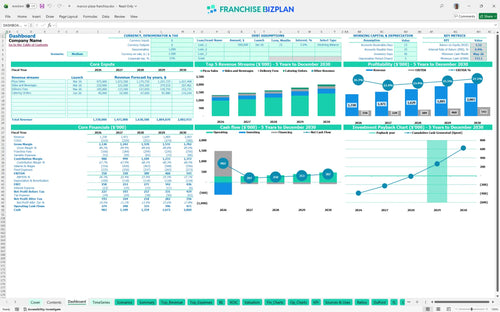
All-in-one Dashboard
Core inputs and core outputs



This template provides a complete restaurant profit and loss statement that updates in real-time as you change your average ticket or weekly order volume.
Core inputs and core outputs
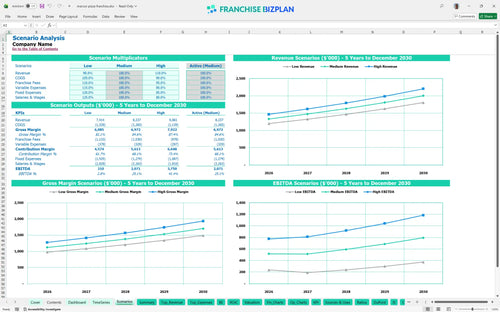
Three scenario analysis
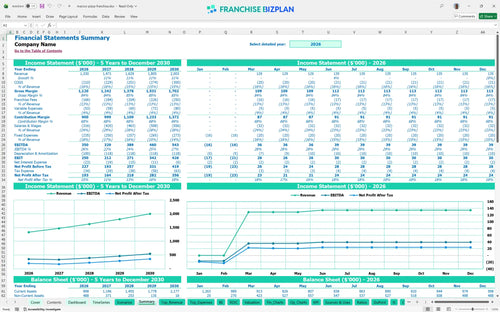
Presentation ready
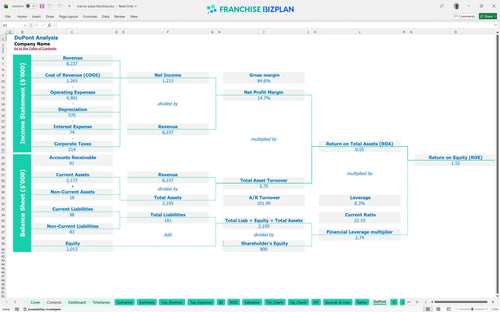
DuPont analysis
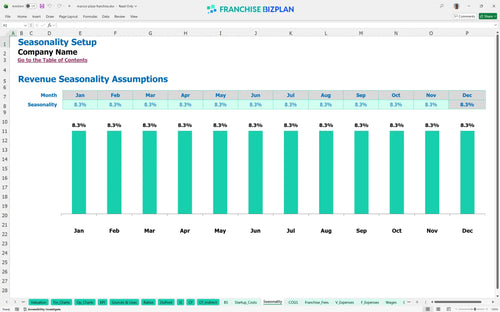
Researched revenue assumptions
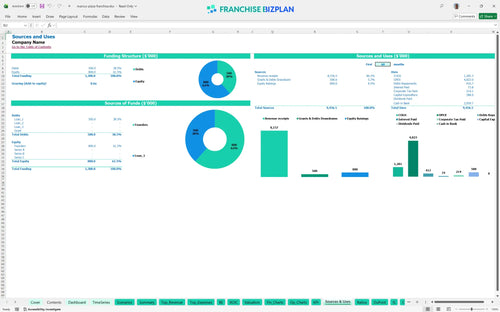
Lender-friendly financial outputs
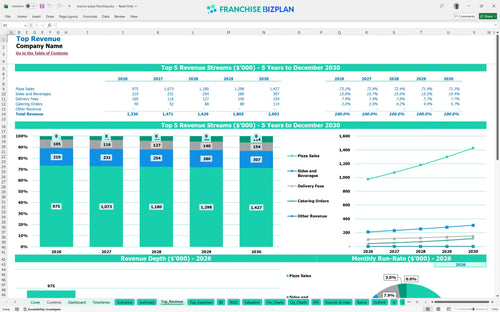
Revenue stream detailed view
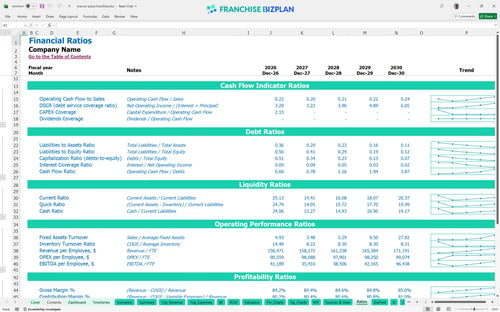
Performance metrics benchmark
We built this financial model using deep research into the pizza industry to ensure your projections are grounded in reality. All assumptions, including the $1.33M year-one revenue target and specific QSR labor models, are pre-populated but remain fully editable to fit your specific market. This data-driven approach helps you move from a rough idea to a professional, bank-ready business plan.
The unit hits positive EBITDA in its first year, generating $350,000 in earnings despite the initial ramp-up. By year five, this franchise profitability analysis shows earnings climbing to $543,000 as local density and brand awareness drive higher throughput.
Your total capital expenditure planning should account for approximately $588,000 in hard costs plus working capital. This pizza franchise unit investment breakdown includes everything from the $25,000 initial fee to the $80,000 needed for high-efficiency ovens and $250,000 for leasehold improvements.
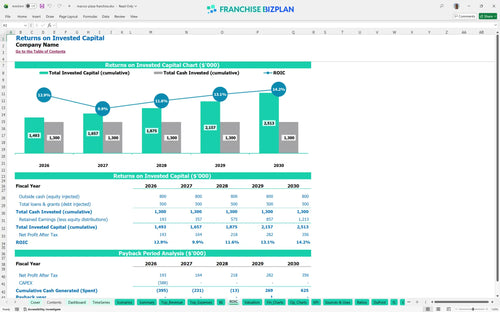
Investors can expect a 4.41% Internal Rate of Return (IRR) with a full payback of the initial investment within 4 years. This ROI calculator for pizza franchise investment also highlights a Return on Equity (ROE) of 1.52, providing key performance indicators for QSR franchise owners to judge the deal.
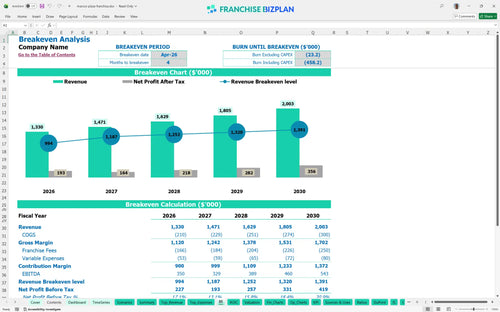
The unit reaches its monthly break-even point in April 2026, just 4 months after launching operations. This Excel template for pizza restaurant financial projections shows that break-even is defintely sensitive to food costs and the 12.5% combined royalty and marketing burden.
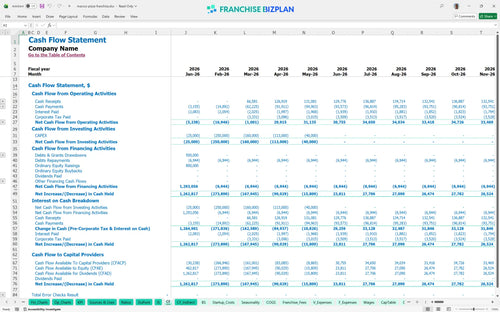
Your lowest cash point is projected at $715,000 in May 2026, meaning you need a solid liquidity buffer to survive the first few months of trading. This restaurant franchise unit cash flow forecast template helps with financial planning for new pizza franchise locations by identifying exactly when cash outflows peak.
The model allows you to toggle between Low, Medium, and High scenarios to see how a 10% drop in traffic affects your 4-year payback. Using best practices for pizza franchise unit financial modeling, you can stress-test your $72,000 manager salary and $14,500 rent against various sales levels.
Finance: update unit break-even and payback model by Friday.
This pizza franchise financial model is built in Excel with fully editable assumptions, allowing you to swap out any pre-filled data for your specific territory or site. You can adjust every formula and driver to see how different labor rates or rent structures impact your bottom line before you sign a lease.

Plan for long-term growth with a franchise unit business plan template that scales from your first day through year five. It tracks the jump from $1,330,000 in year one revenue to over $2,003,000 by year five, helping you visualize the path from a single startup to a mature, high-performing location. Using this restaurant financial forecasting Excel tool ensures your growth strategy is backed by hard numbers.

Operating within a brand system requires precise tracking of the franchise royalty fee structure and brand fund obligations. This model automatically calculates the 5.5% royalty and 7% marketing fee against your gross sales, so you know exactly what is owed to corporate every month. Understanding franchise royalty and marketing fees is critical because these off-the-top costs directly squeeze your store-level margin.

Knowing how to calculate startup costs for a pizza franchise is the first step to avoiding a cash crunch during the build-out phase. This tool aggregates your $25,000 franchise fee, $250,000 in leasehold improvements, and equipment needs to show your total entry price. It maps these pizza restaurant startup costs against your expected traffic to find the exact moment your operations stop burning cash.

We have integrated unit economics analysis and QSR operational expenses to help you sanity-check your projections against industry norms. For instance, the model tracks food ingredients starting at 14.2% of sales, which is a vital metric for estimating food cost percentage for pizza restaurants. These benchmarks allow you to see if your $14,500 monthly rent or staffing levels are in line with high-performing units.


Simply purchase and download the financial model template, then access it instantly using Microsoft Excel or Google Sheets. No installation or technical expertise required-just open and start working.

Enter your business-specific numbers, including revenue projections, costs, and investment details. The pre-built formulas will automatically calculate financial insights, saving you time and effort.

Leverage the investor-ready format to confidently showcase your financial projections to banks, franchise representatives, or investors. Impress stakeholders with clear, data-driven insights and professional reports.

Leverage the investor-ready format to confidently present your projections to banks, franchise representatives, or investors.