
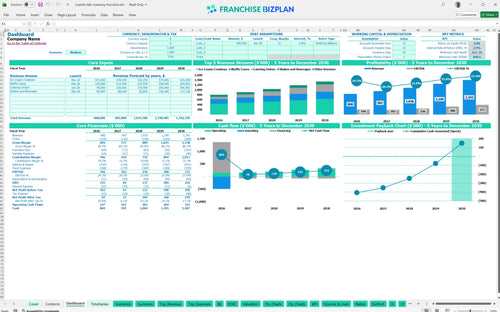
All-in-one Dashboard
Core inputs and core outputs


This comprehensive Excel template provides a data-driven framework for evaluating the startup costs, daily operating expenses, and five-year earnings potential of a premium dessert franchise unit.
Core inputs and core outputs
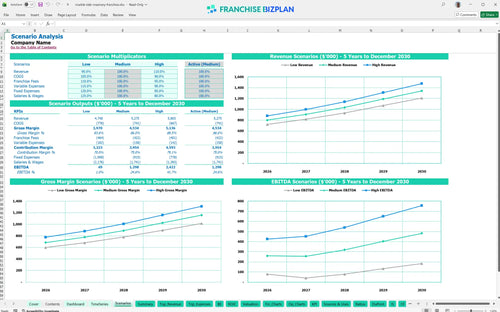
Three scenario analysis
Presentation ready
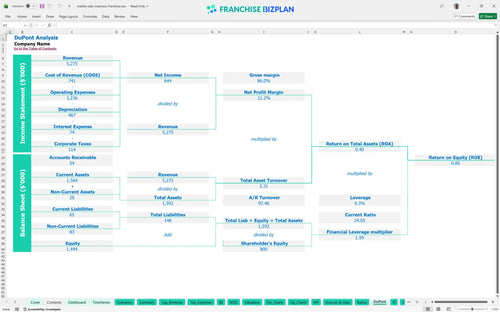
DuPont analysis
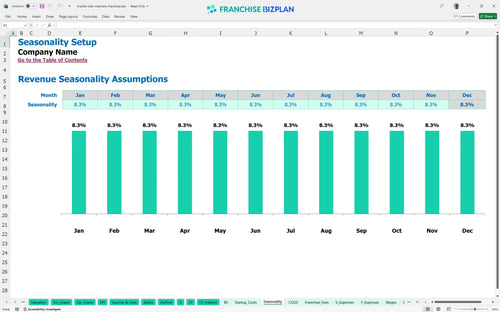
Researched revenue assumptions
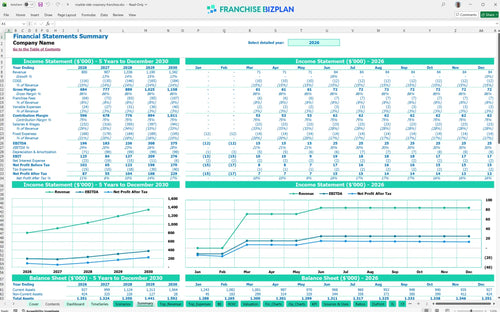
Lender-friendly financial outputs
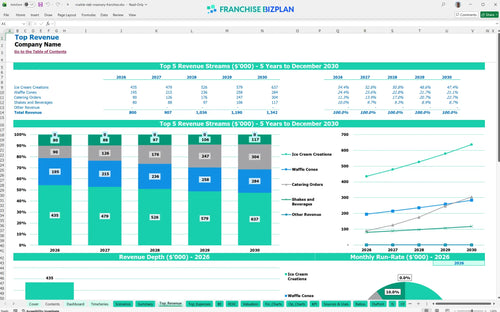
Revenue stream detailed view
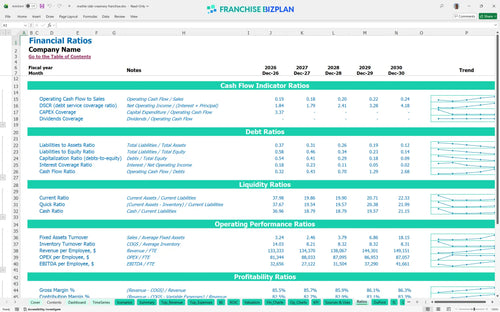
Performance metrics benchmark
We built this franchise unit financial model using our own research into the premium ice cream sector. Key assumptions, including the $800,000 year-one revenue and the 4-month break-even target, are pre-populated and fully editable to reflect your specific location. This tool covers everything from the $25,000 initial fee to the $375,000 year-five EBITDA projection to give you a clear roadmap for success.
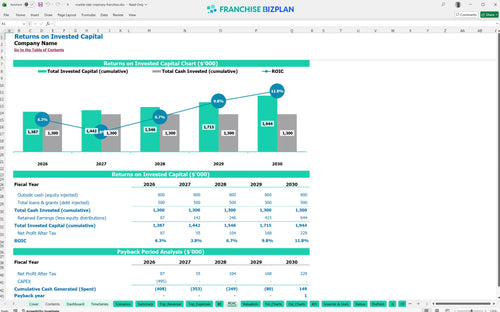
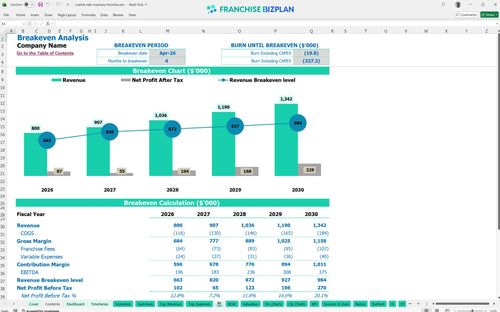
Based on our research, Year 1 EBITDA starts at $196,000 and grows to $375,000 by Year 5 as the unit matures. This franchise unit profitability analysis shows the store defintely hits its stride as you learn how to forecast revenue for a dessert franchise and scale catering to $202,987 annually. Here is the quick math: rising volume against fixed rent drives the margin expansion.
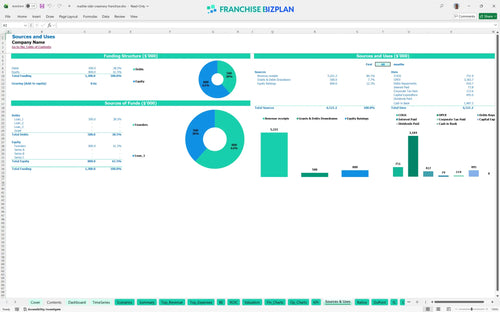
To get the doors open, you are looking at a $490,000 total investment including a $25,000 franchise fee and $250,000 for leasehold improvements. This Excel template for ice cream shop financial projections helps with capital expenditure planning, ensuring you account for the $869,000 minimum cash needed to maintain a safe buffer during the ramp-up phase.
The model projects an Internal Rate of Return (IRR) of 2.92% with a 5-year payback period for the initial capital. While the Return on Equity (ROE) sits at 0.8, the franchise investment analysis shows steady growth as annual revenue climbs from $800,000 to $1.34 million. Still, the real value for a multi-unit operator is the consistent cash flow generated after the store reaches maturity.
The unit hits its break-even point in April 2026, just 4 months after the March launch. Calculating break-even point for retail food franchises is easier when you see how the $10,000 monthly rent and 6% royalty burden interact with your daily foot traffic and average ticket size. What this estimate hides is the need for tight labor control during those first 120 days.
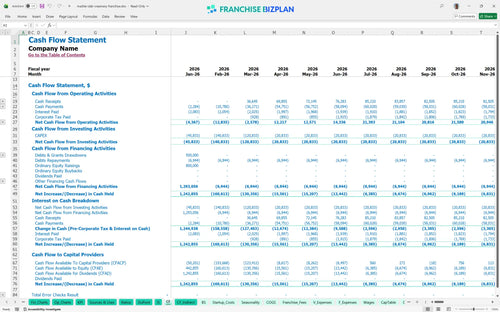
Your lowest cash point is projected at $869,000 in December 2026, suggesting you need a solid capital cushion to handle the first year of operations. This franchise unit profit and loss statement example accounts for crew member growth and the $10,000 monthly rent, but you must watch your cash runway closely if the build-out takes longer than expected.
Moving from a medium to a high scenario depends on your ability to execute local marketing and capture foot traffic. Financial forecasting tools for new franchise owners let you toggle revenue growth from the $800,000 baseline to see how a restaurant franchise unit economics template handles different labor and COGS pressures. Plus, the high case assumes you nail the corporate catering contracts early.
This franchise financial model template is built in Excel to give you total control over your investment assumptions. You can easily adjust the pre-filled formulas for revenue drivers, staffing levels, and local rent to see how different operating scenarios impact your bottom line. It is a flexible tool designed to adapt to your specific territory and market conditions without requiring advanced accounting skills.

Long-term planning is essential for any multi-unit operator or first-time buyer. This model delivers detailed retail franchise financial projections covering five years of revenue, cash flow, and profit. By using this tool for your franchise ROI calculation, you can see how the business matures from the initial opening phase to a fully ramped-up operation with multiple revenue streams. Use this to build a professional franchise business plan Excel workbook for lenders or partners.

Operating within a brand system means managing recurring costs that impact your store-level margin. This model includes a dedicated franchise royalty fee and marketing cost analysis, capturing the 6% royalty and 2% brand fund contributions automatically. It ensures you understand the real economics of the business after all brand-mandated obligations are met. This is standard operating expenses for ice cream store franchises planning.

Knowing how to calculate startup costs for a food franchise is the first step toward a successful launch. This tool breaks down your total initial investment, from leasehold improvements to specialized equipment, so you know exactly how much capital is at risk. It also provides a clear view of the sales volume required to cover your $10,000 monthly rent and other fixed overheads. This ensures your restaurant franchise startup costs are fully accounted for before you sign a lease.

Our model incorporates industry-standard benchmarks to help you perform a realistic unit economics assessment. You can compare your projected labor costs and gross margins against typical ranges for the dessert sector to ensure your plan is grounded in reality. This operating expense forecasting feature acts as a sanity check, helping you identify if your rent or staffing assumptions are out of line with high-performing units.


Simply purchase and download the financial model template, then access it instantly using Microsoft Excel or Google Sheets. No installation or technical expertise required-just open and start working.

Enter your business-specific numbers, including revenue projections, costs, and investment details. The pre-built formulas will automatically calculate financial insights, saving you time and effort.

Leverage the investor-ready format to confidently showcase your financial projections to banks, franchise representatives, or investors. Impress stakeholders with clear, data-driven insights and professional reports.

Leverage the investor-ready format to confidently present your projections to banks, franchise representatives, or investors.