
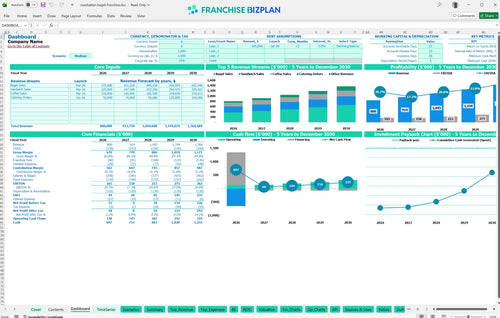
All-in-one Dashboard
Core inputs and core outputs


This franchise unit financial model template provides a complete Excel-based toolkit for forecasting revenue, managing operating expenses, and calculating the total return on investment for a bagel shop.
Core inputs and core outputs
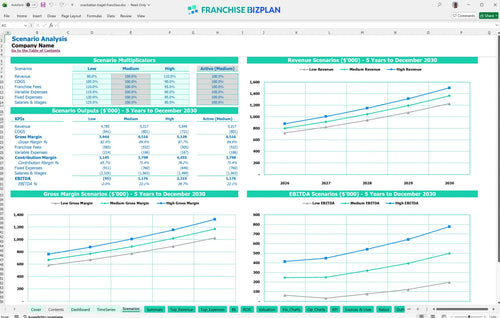
Three scenario analysis
Presentation ready
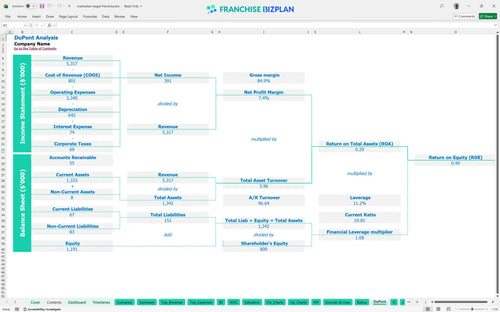
DuPont analysis
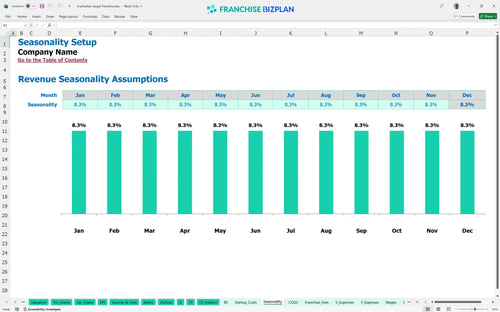
Researched revenue assumptions
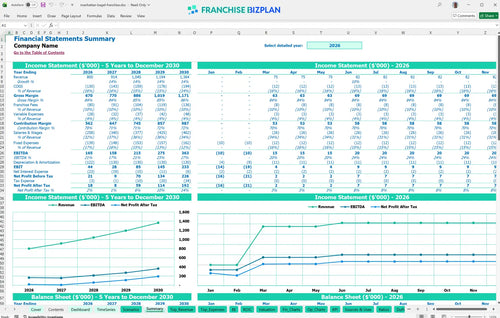
Lender-friendly financial outputs
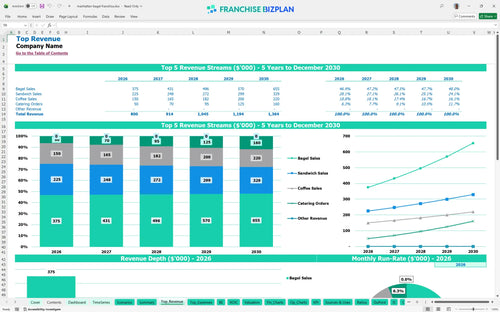
Revenue stream detailed view
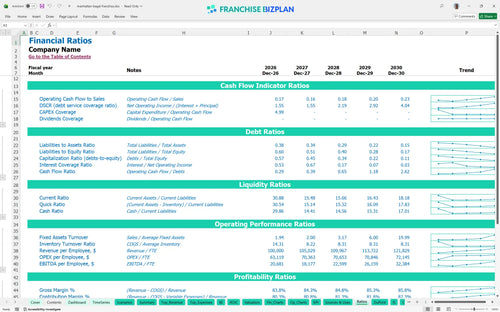
Performance metrics benchmark
We developed this Manhattan Bagel Franchise financial model using detailed research to ensure your planning is based on real-world unit economics. The model comes pre-populated with key data, including $800,000 in year-one revenue and $165,000 in EBITDA, but remains fully editable to suit your specific location. It covers everything from the $25,000 franchise fee to monthly operating budget for small food franchise needs.
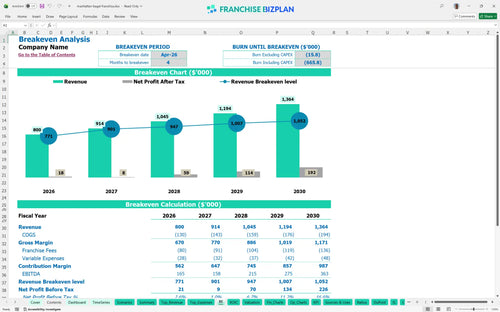
The unit is projected to reach its break-even date in April 2026, just four months after launching. This financial model for coffee and breakfast shop shows year-one EBITDA at $165,000, with profitability scaling as catering and sandwich sales ramp up. Steady growth in high-margin coffee sales is the key to accelerating this timeline.
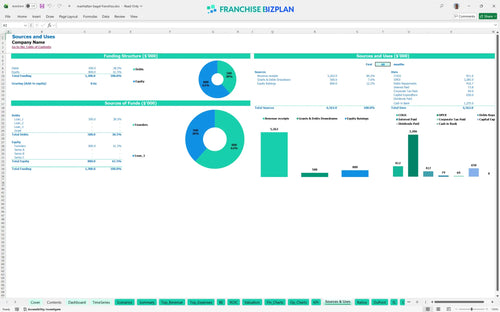
To learn how to calculate startup costs for a bagel franchise, you must look at the $650,000 total CAPEX (capital expenditure). This includes $300,000 for leasehold improvements and $150,000 for bakery equipment, plus a cash buffer to handle the $613,000 minimum cash point in March 2026. Startup funding requirements for bagel business models must account for these heavy upfront costs before revenue stabilizes.
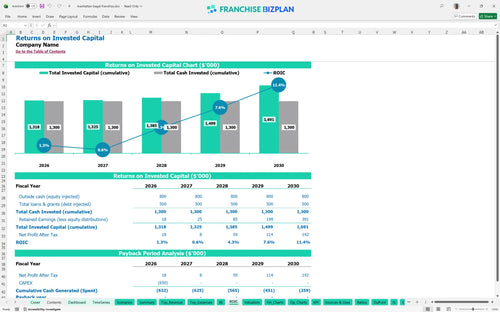
Based on the return on investment metrics, a franchisee can expect an IRR of 1.39% and an ROE of 0.49. While the payback period extends beyond year five, the annual EBITDA grows significantly to $363,000 by the fifth year of operation. Evaluating franchise investment opportunities with excel allows you to see how long-term equity builds even when initial cash returns are modest.
The break-even analysis indicates you need to cover approximately $12,000 in monthly fixed costs, including the $8,000 prime location rent. Reaching this point in four months depends heavily on maintaining an efficient average ticket and high throughput during the 6 AM to 10 AM window. Labor and royalty burdens are the biggest variable pressures on this calculation.
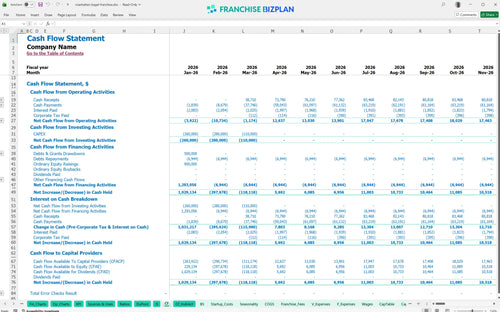
The franchise unit cash flow projection spreadsheet shows the lowest cash point occurring in March 2026 at $613,000. You defintely need to ensure your initial funding covers the gap between the $25,000 franchise fee payment and the start of catering revenue in June. Managing the timing of equipment payments is the best way to protect your liquidity during the build-out phase.
Forecasting revenue for local food service franchise units involves comparing $800,000 base-year sales against high-growth scenarios that could reach $1.36 million. A high-performance case improves the profit margin analysis for breakfast catering business lines, significantly shortening the payback period. Conversely, a low-revenue scenario makes the 10% combined royalty and marketing fee much harder to absorb.
Finance: update unit break-even and payback model by Friday.
This franchise financial model template is built in Excel with fully editable assumptions, allowing you to adjust every driver from bagel pricing to local labor rates. You can modify the pre-filled formulas to test different operating scenarios, ensuring the math fits your specific territory and real estate costs. It is a flexible tool designed to help you move from a generic plan to a precise, data-driven strategy for your location.

Planning for long-term success requires more than a one-year view, so this model provides a detailed 5-year food service financial forecast. It tracks revenue growth from $800,000 in year one to over $1.36 million by year five, mapping out the trajectory of your cash flow and net profit. This long-term perspective is essential for understanding how scaling sales and managing margins impact your bottom line over time.

This tool simplifies the royalty fee calculation by automating the 5% royalty and 5% marketing fund contributions based on your monthly sales projections. It also accounts for the initial $25,000 franchise fee, ensuring these brand-specific obligations are baked into your store-level economics from day one. Understanding these recurring costs is vital to protecting your margins and ensuring the franchisor's take doesn't squeeze your local cash flow.

Using this restaurant startup cost spreadsheet, you can estimate the total initial investment, which totals approximately $650,000 for this concept including leasehold improvements and bakery equipment. The model calculates the exact sales volume needed to cover your $12,000 in monthly fixed costs, providing a clear path to sustainability. Knowing your break-even point helps you manage expectations during the critical first few months of operation.

We included built-in benchmarks for a franchise profitability analysis, such as food ingredient costs starting at 14.2% and tiered labor structures. These numbers allow you to compare your projected performance against typical food service standards to ensure your targets are realistic. Sanity-checking your occupancy and COGS (cost of goods sold) against these benchmarks helps identify potential margin leaks before you sign a lease.


Simply purchase and download the financial model template, then access it instantly using Microsoft Excel or Google Sheets. No installation or technical expertise required-just open and start working.

Enter your business-specific numbers, including revenue projections, costs, and investment details. The pre-built formulas will automatically calculate financial insights, saving you time and effort.

Leverage the investor-ready format to confidently showcase your financial projections to banks, franchise representatives, or investors. Impress stakeholders with clear, data-driven insights and professional reports.

Leverage the investor-ready format to confidently present your projections to banks, franchise representatives, or investors.