
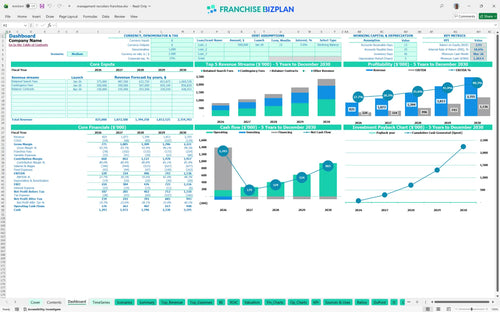
All-in-one Dashboard
Core inputs and core outputs


This comprehensive Excel template provides a dynamic, data-driven framework for forecasting revenue, managing expenses, and analyzing the long-term ROI of your executive search franchise unit.
Core inputs and core outputs
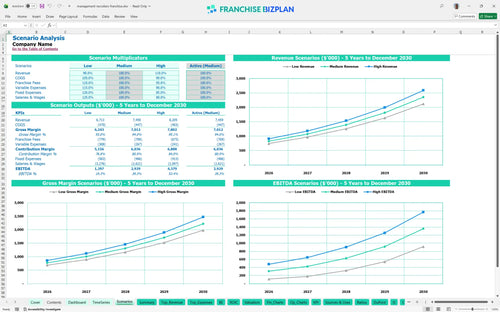
Three scenario analysis
Presentation ready
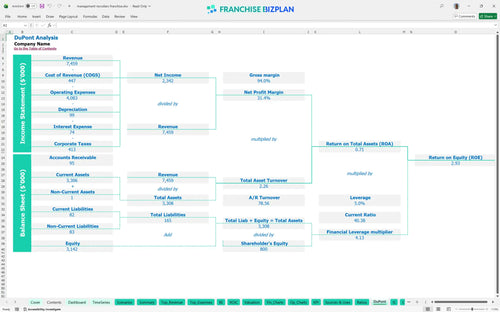
DuPont analysis
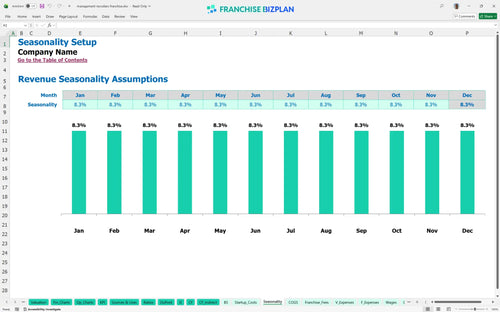
Researched revenue assumptions
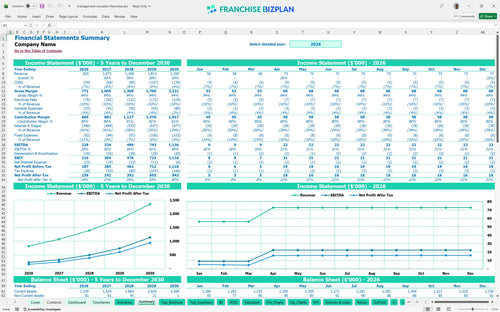
Lender-friendly financial outputs
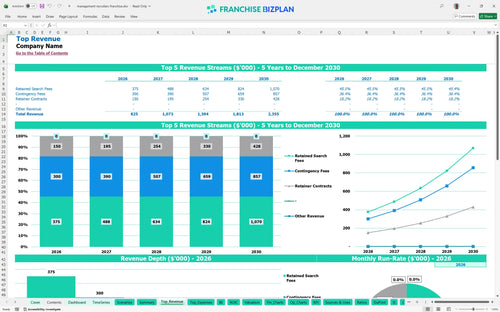
Revenue stream detailed view
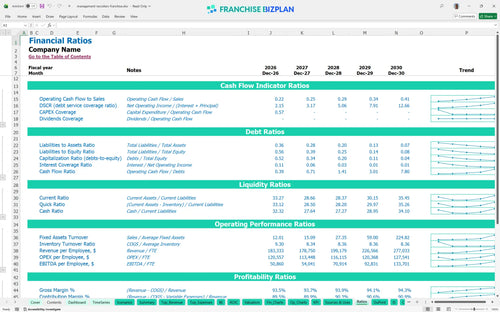
Performance metrics benchmark
We built this franchise unit financial model using deep research into executive search operations and brand-specific cost structures. The model comes pre-populated with data like a $229,000 year-one EBITDA and a 9% royalty rate, but you can defintely edit every field to match your local Austin market or specific niche. It is a practical tool designed to help you see if the $825,000 initial revenue target is achievable given your planned staffing levels.
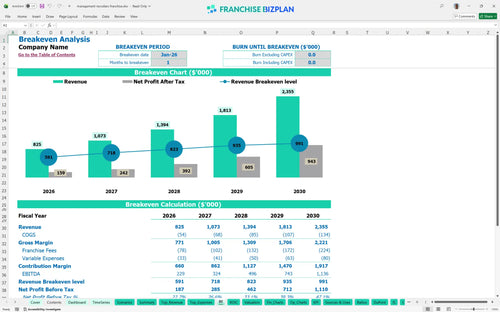
The unit hits profitability almost immediately, with a break-even date in January 2026, just one month after launch. With year-one EBITDA starting at $229,000 and scaling to $1.13 million by year five, the trajectory is aggressive but relies on high-ticket retained search fees. Every placement counts when you're scaling a high-touch search firm.
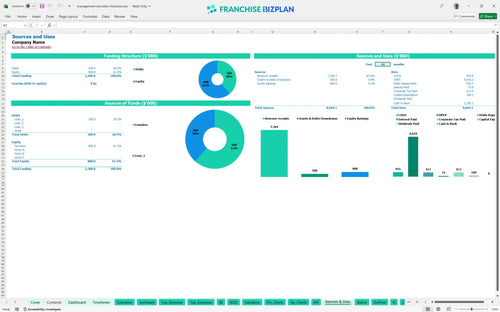
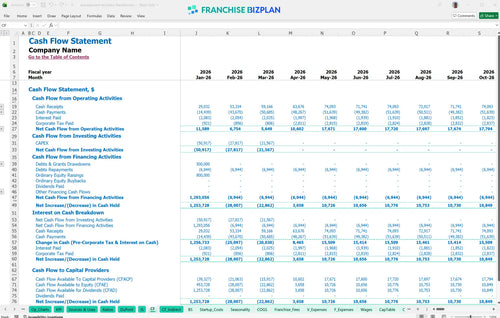
You will need a significant capital stack to start, including a $40,000 franchise fee and roughly $100,000 in physical assets and pre-opening costs. The model shows a minimum cash requirement of $1,203,000 in March 2026, which includes a heavy buffer for working capital and payroll as you ramp up your recruiter headcount. This ensures you can carry the $98,000 principal salary before the big fees start rolling in.
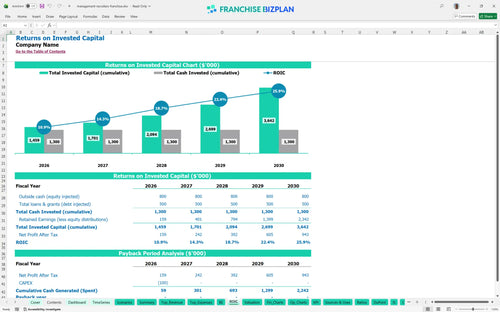
The model projects an Internal Rate of Return (IRR) of 18.58% and a Return on Equity (ROE) of 2.93, which are solid for a professional services firm. However, because of the high initial cash buffer required, the full payback period extends beyond the five-year mark. You are building a high-value asset, but you have to be patient with the initial cash recovery.
Break-even occurs in the very first month, January 2026, assuming you launch with a pipeline of retained search fees ready to close. The primary driver for staying above break-even is your monthly fixed overhead, specifically the $4,800 rent and the $27,000+ monthly payroll for your initial team. If search cycles drag on longer than 90 days, your monthly burn will test your cash reserves quickly.
Your lowest cash point hits in March 2026 at $1,203,000, which reflects the timing gap between hiring your team and collecting on those first big contingency fees. You need enough runway to cover several months of $40,000+ in total operating expenses while your recruiters source candidates. Honestly, having a large buffer is what keeps you from making desperate, low-quality placements just to pay the bills.
In a high-growth scenario, hitting $2.3 million in revenue by year five dramatically shifts your EBITDA margin as fixed costs like rent stay flat. A low scenario where search fees drop by 20% would significantly delay your payback and might require cutting the $62,000 Business Development Specialist role. The model allows you to stress-test these scenarios to see how sensitive your 18.58% IRR is to market fluctuations.
This recruitment franchise financial model is built entirely in Excel with open formulas, so you can tweak every assumption to fit your specific market. Whether you are adjusting headhunter commissions or office rent in a premium district, the editable cells allow for instant updates across the entire executive search franchise business plan. It is designed to handle the nuances of professional services without the headache of building a spreadsheet from scratch.

Planning for a long-term exit requires more than just a one-year outlook, so this franchise unit financial projection template delivers a full 60-month view. You can track how revenue scales from $825,000 in year one to over $2.3 million by year five while monitoring how your margin evolves as you add more recruiters. It provides a clear roadmap for growth, showing exactly how your cash flow and balance sheet should look as the business matures.

The model specifically tracks your 9% royalty and 0.5% marketing fund contributions to ensure you see the true net income after all brand obligations. By factoring in the $40,000 initial fee and ongoing percentages, you get a realistic view of how franchise costs impact your store-level EBITDA. Understanding these numbers is vital for estimating profitability for a niche recruitment agency where overhead can creep up fast.

Calculating staffing agency franchise startup costs involves more than just the franchise fee; you have to account for leaseholds, IT hardware, and a healthy cash buffer. This tool helps you map out the total investment and identifies the exact sales volume needed to cover your fixed costs like the $4,800 monthly office rent. Knowing your break-even point helps you manage the early months when you are still building your candidate database.

We have integrated industry-standard benchmarks into this franchise profitability analysis Excel to help you sanity-check your labor and occupancy costs. If your Principal Recruiter salary of $98,000 or your CRM software costs feel out of line, the model highlights those gaps against typical executive search firms. This ensures your financial projections for staffing and recruitment franchises stay grounded in reality rather than best-case scenarios.


Simply purchase and download the financial model template, then access it instantly using Microsoft Excel or Google Sheets. No installation or technical expertise required-just open and start working.

Enter your business-specific numbers, including revenue projections, costs, and investment details. The pre-built formulas will automatically calculate financial insights, saving you time and effort.

Leverage the investor-ready format to confidently showcase your financial projections to banks, franchise representatives, or investors. Impress stakeholders with clear, data-driven insights and professional reports.

Leverage the investor-ready format to confidently present your projections to banks, franchise representatives, or investors.