


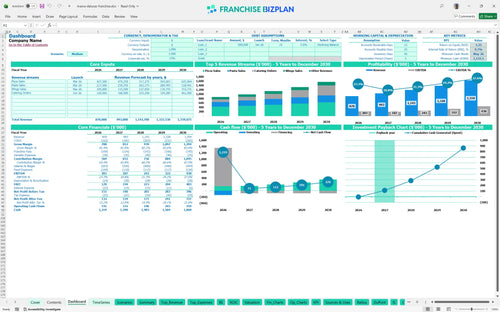
All-in-one Dashboard
Core inputs and core outputs



This Excel template for restaurant franchise financial projections provides a complete roadmap from initial build-out to a mature five-year cash flow analysis. This is the complete toolkit for a new owner.
Core inputs and core outputs
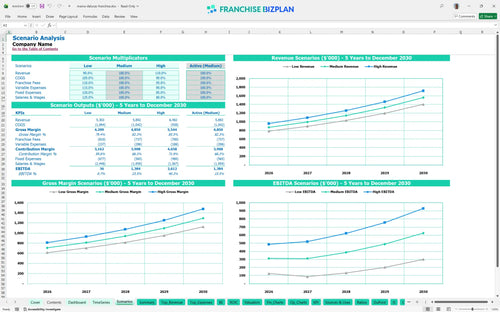
Three scenario analysis
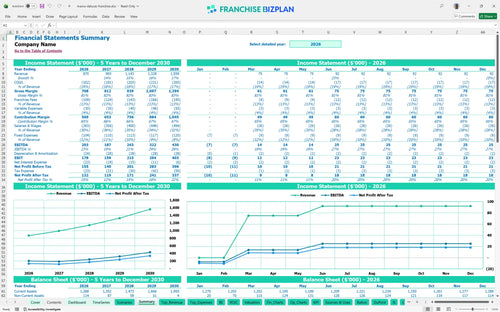
Presentation ready
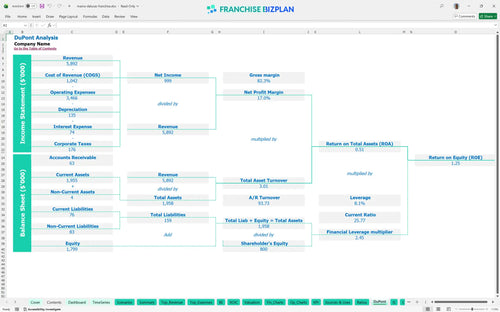
DuPont analysis
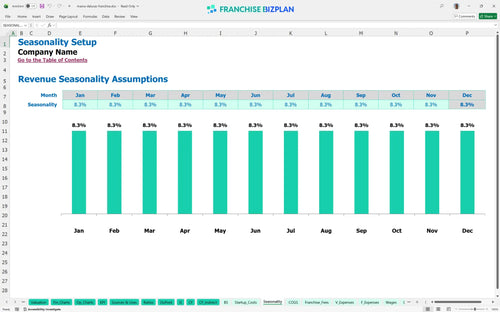
Researched revenue assumptions
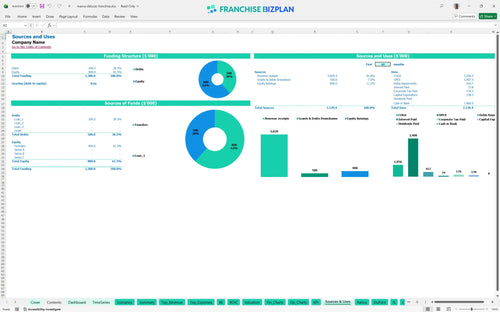
Lender-friendly financial outputs
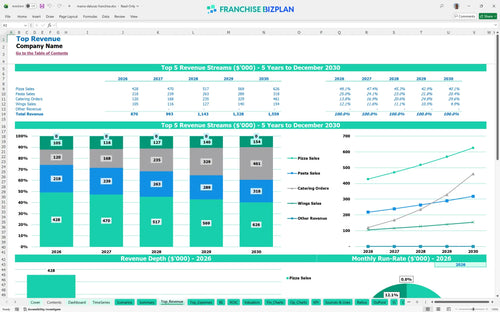
Revenue stream detailed view
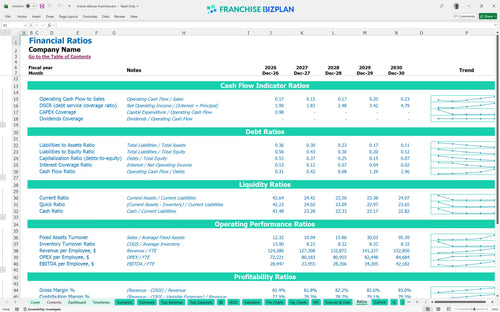
Performance metrics benchmark
We built this franchise unit financial model using our own research on co-located restaurant units. Key assumptions like the 1.3% payment processing fees and $64,000 manager salary are pre-populated and ready for your local adjustments. With a projected year-one EBITDA of $203,000, the model shows a strong starting point for operators. Data-driven planning beats gut feeling every time.
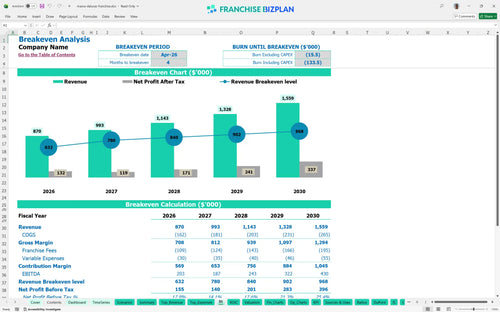
The franchise unit is projected to reach profitability by April 2026, just four months after the initial launch. While year two EBITDA dips slightly to $187,000 during the ramp-up, the model shows a steady climb to $430,000 in annual profit by the fifth year. Profitability is a marathon, not a sprint.
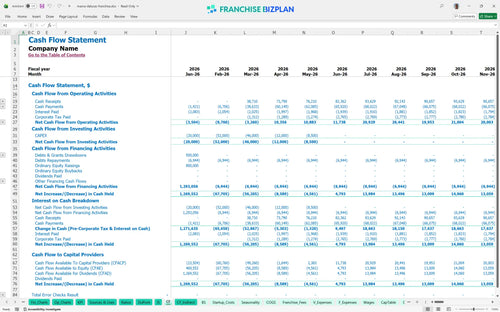
Launching this financial model for co-located restaurant franchise unit requires significant capital, with a minimum cash requirement of $1,132,000 identified for May 2026. This total covers the initial $5,000 franchise fee, leasehold improvements, and essential baking equipment. Capital is the fuel for your franchise engine.
Franchisees can expect an Internal Rate of Return (IRR) of 9.68% and a Return on Equity (ROE) of 1.25 based on the five-year forecast. The payback period is estimated at 2 years, which is a strong result for a retail pizza franchise startup. Your money should work as hard as you do.
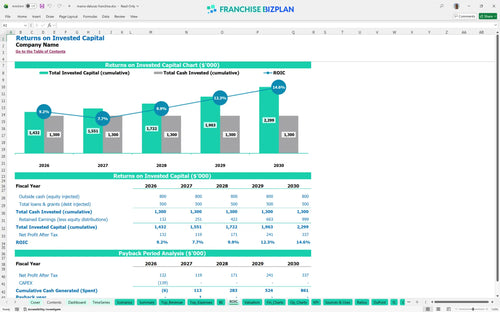
The monthly break-even point is reached in April 2026, supported by the launch of high-margin catering orders in June of that year. Success depends on managing the $5,800 monthly rent and the 12.5% combined royalty and marketing fee burden. Break-even is your first major milestone.
The lowest cash point occurs in May 2026 at $1,132,000, which suggests you need a solid buffer during the first six months of operation. If the catering launch is delayed, you will defintely need extra working capital to cover the $10,000+ in monthly fixed costs and wages. Cash is king, especially during the ramp-up.
A high-performance scenario significantly boosts the $1,559,000 year-five revenue target and improves the 9.68% IRR by maximizing kiosk throughput. Conversely, low scenarios highlight the risk of food costs rising above the 16.8% baseline or delivery commissions eating into margins. Planning for the worst helps you achieve the best.
Finance: update unit break-even and payback model by Friday
This franchise financial model template is a flexible Excel tool designed for high-precision planning. You can easily modify pre-filled formulas and editable assumptions to match your specific territory, local labor market, or unique site selection needs. Every cell is open for your own local data.

We built this model to provide a clear five-year outlook for your pizza franchise, tracking revenue growth from $870,000 in year one to over $1.5 million by year five. These projections include detailed income statements and cash flow views to ensure your multi-unit operation forecasting remains accurate as you scale. Five years of data lets you see past the honeymoon phase.

This tool specifically tracks the 8% royalty and 4.5% marketing fund contributions that impact your store-level margin. By including the $5,000 initial franchise fee in the startup cost section, the model provides a realistic view of your ongoing financial obligations to the brand. Royalties are a reality you can't ignore.

Understanding your restaurant franchise startup costs is essential for securing financing and managing expectations. The model breaks down the $45,000 leasehold improvements and $28,000 in equipment costs to calculate the exact sales volume needed to cover your $5,800 monthly rent. Knowing your number helps you sleep at night.

We integrated food service financial forecasting benchmarks, such as a 16.8% food ingredient cost, to help you sanity-check your projections. These built-in metrics allow you to compare your expected performance against industry standards for quick service restaurant economics. Don't guess when you can benchmark.


Simply purchase and download the financial model template, then access it instantly using Microsoft Excel or Google Sheets. No installation or technical expertise required-just open and start working.

Enter your business-specific numbers, including revenue projections, costs, and investment details. The pre-built formulas will automatically calculate financial insights, saving you time and effort.

Leverage the investor-ready format to confidently showcase your financial projections to banks, franchise representatives, or investors. Impress stakeholders with clear, data-driven insights and professional reports.

Leverage the investor-ready format to confidently present your projections to banks, franchise representatives, or investors.