


All-in-one Dashboard
Core inputs and core outputs



This sample financial forecast for retail franchise unit operations includes everything from POS subscriptions to visual merchandising costs. This tool is the bridge between a dream and a bankable business plan.
Core inputs and core outputs

Three scenario analysis
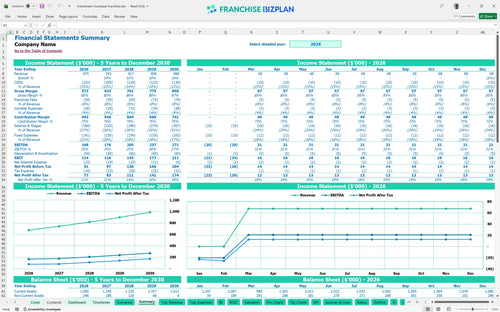
Presentation ready
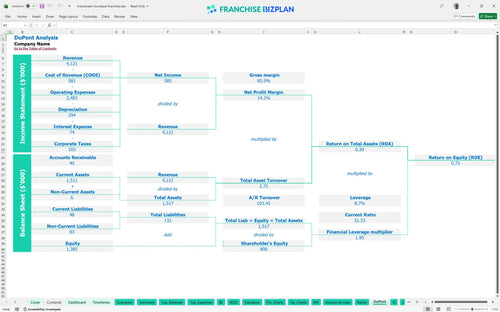
DuPont analysis

Researched revenue assumptions
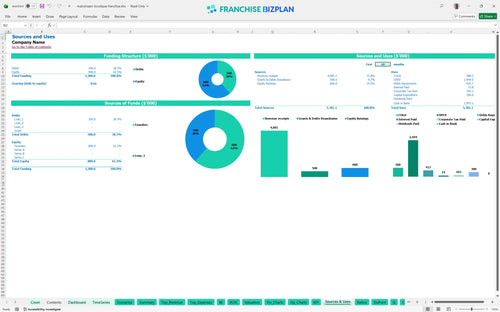
Lender-friendly financial outputs

Revenue stream detailed view

Performance metrics benchmark
We built this franchise unit financial model using our own research into the boutique market to provide a realistic roadmap for owners. Key assumptions like the $675,000 year-one revenue and the $40,000 initial franchise fee are pre-populated and fully editable to fit your specific location. It covers everything from styling consultant wages to the exclusive inventory lines you will carry in your store.
This unit hits profitability quickly because the EBITDA starts at $168,000 in the first year. By year five, you are looking at $271,000 in earnings as revenue scales toward $988,000. Here's the quick math: keeping merchandise costs under 14.5% is the key to staying in the black.
You will need roughly $300,000 for the initial build-out and fees to launch in the US market. Estimating inventory costs for retail franchise startup is built into the working capital assumptions to ensure you are ready for the grand opening. Getting the fixtures and leasehold right is your biggest upfront hurdle.
The model shows a 3.95% IRR and a 4-year payback period, which is standard for a high-touch retail play. Calculating franchise profitability and return on investment requires looking at the 0.73 ROE to see how hard your cash is working. Still, the steady EBITDA growth makes the long-term play defintely interesting.

Break-even occurs in April 2026, just four months after the March launch. This assumes you hit your $675,000 annual target and keep the $7,000 monthly rent in check. This franchise business model financial spreadsheet helps you track how ticket size affects this date. Speed to break-even is the best indicator of a healthy location.

Your lowest cash point hits $942,000 in March 2026 during the final setup phase. You need enough runway to cover the $1,800 CAM and $8,800 in monthly manager and assistant salaries before sales ramp up. Cash is oxygen, especially during the first 120 days of trading.
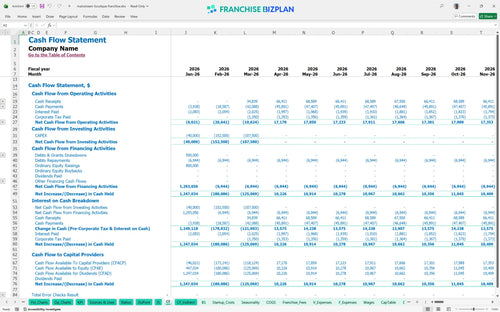
The high scenario projects revenue reaching $988,000 by year five with EBITDA margins expanding as merchandise costs drop to 12.5%. Projected revenue and expenses for clothing boutique units can swing based on local styling consultant productivity. Scenarios prove that small wins in retention lead to big gains in profit.
Finance: update unit break-even and payback model by Friday.
How to create a financial model for a clothing boutique starts with getting your unit economics right in a flexible Excel environment. This franchise financial model template is fully customizable, allowing you to edit every formula and assumption to match your specific territory and local market conditions. You can adjust revenue drivers, staffing levels, and operating costs in real-time to see the immediate impact on your bottom line. Edit any cell to see how local rent impacts your store-level margin.

This women's clothing boutique financial projection excel tool maps out your growth from $675,000 in year one to nearly $1,000,000 by year five. Small business financial forecasting requires a long-term view to account for seasonal inventory shifts and the ramp-up of styling consultants. You get a clear look at your five-year revenue, profit, and cash flow to ensure the business remains sustainable as it matures. A five-year view helps you plan for the inevitable retail cycle shifts.

Financial planning tools for new franchise owners must account for the 7.5% royalty fee and 0.5% marketing fund contribution that come right off the top. This model captures these specific financial obligations along with the initial $40,000 franchise fee so you understand the real cost of brand support. It tracks ongoing franchise royalty fees against your gross sales to ensure your net margins stay healthy. Royalties are a top-line hit, so your store-level margin must be protected.

This retail franchise startup cost breakdown template identifies the $130,000 leasehold improvement as your biggest upfront hurdle. By conducting a detailed break-even analysis, you can determine exactly what monthly sales volume is required to cover your fixed costs like the $7,000 monthly rent. Knowing your break-even month keeps the stress manageable during the initial ramp-up phase. Retail franchise startup costs are manageable only when you know where every dollar is going.

A boutique franchise operating budget template helps you monitor the $1,800 monthly CAM and $1,100 utility costs against industry standards. This model includes franchise unit profitability analysis benchmarks for labor and occupancy to help you sanity-check your operating expenses. Comparing your expected performance against typical gross margin ranges ensures your business plan is grounded in reality. Benchmarking your labor against the 15-20% range is vital for boutique health.


Simply purchase and download the financial model template, then access it instantly using Microsoft Excel or Google Sheets. No installation or technical expertise required-just open and start working.

Enter your business-specific numbers, including revenue projections, costs, and investment details. The pre-built formulas will automatically calculate financial insights, saving you time and effort.

Leverage the investor-ready format to confidently showcase your financial projections to banks, franchise representatives, or investors. Impress stakeholders with clear, data-driven insights and professional reports.

Leverage the investor-ready format to confidently present your projections to banks, franchise representatives, or investors.