
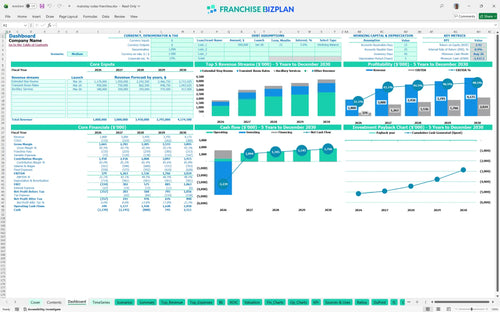
All-in-one Dashboard
Core inputs and core outputs


This franchise unit financial model template provides a complete roadmap for an extended stay hotel, covering everything from initial CAPEX to 5-year cash flow projections.
Core inputs and core outputs
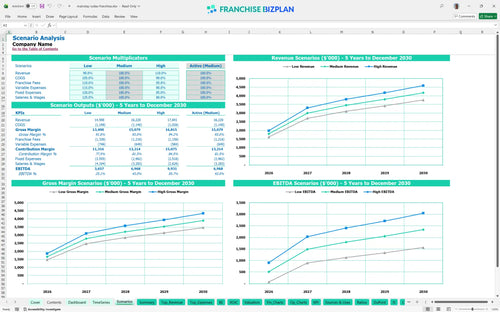
Three scenario analysis
Presentation ready
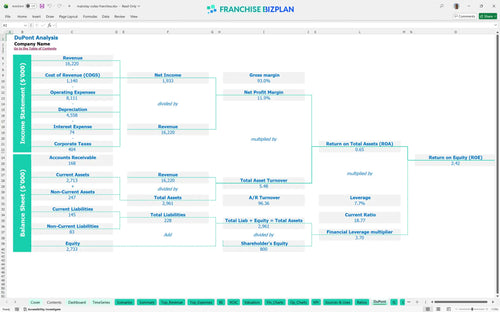
DuPont analysis
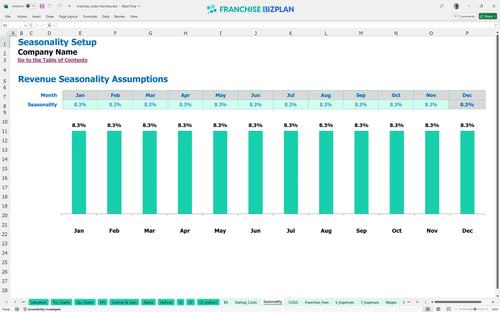
Researched revenue assumptions
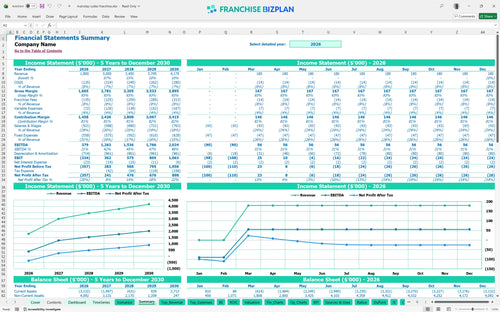
Lender-friendly financial outputs
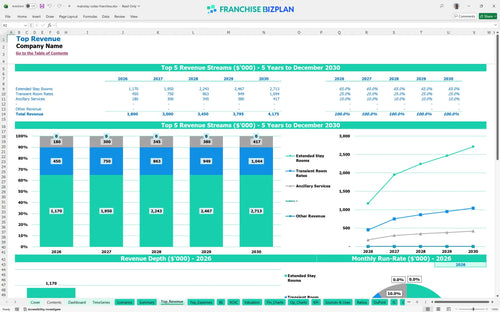
Revenue stream detailed view
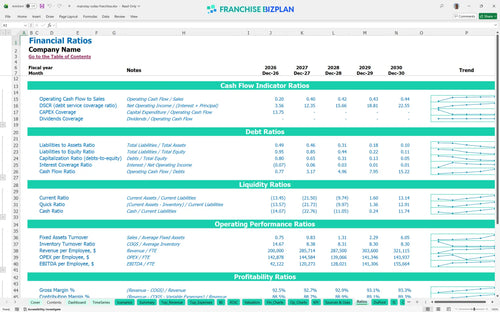
Performance metrics benchmark
We built this franchise unit financial model using our own research to help you navigate the complexities of hotel operational expense forecasting. Key assumptions like the $1.8 million Year 1 revenue and the 5% royalty fee structure are pre-populated and fully editable to match your specific territory and site selection needs.
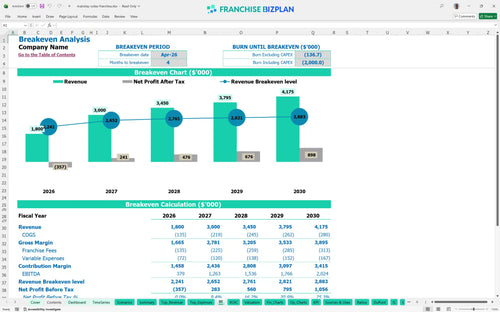
This extended stay hotel franchise is projected to reach profitability in its first year, with Year 1 EBITDA starting at $379,000 and scaling to over $2 million by Year 5. While the initial months involve heavy ramp-up, the break-even date is estimated for April 2026, just four months after the launch of operations.
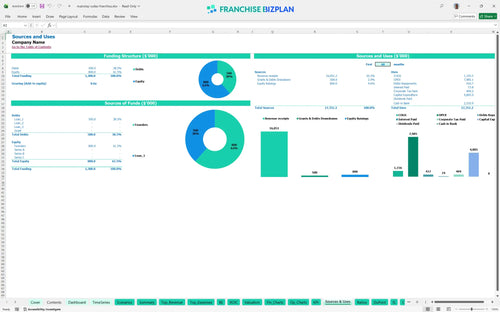
Launching this unit requires significant upfront capital, primarily driven by $2.5 million in leasehold improvements and $1.2 million for furniture and fixtures. Total initial investment exceeds $4.9 million when you include the $800,000 for suite kitchen appliances and the $30,000 initial franchise fee required to start.
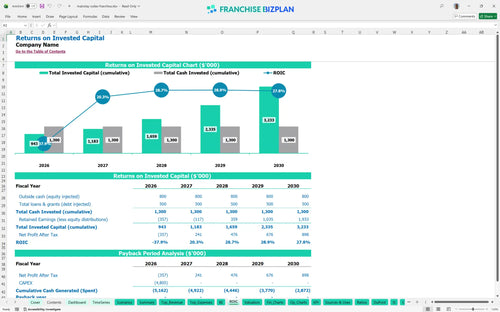
Investors can expect an Internal Rate of Return (IRR) of 0.91% and a Return on Equity (ROE) of 2.42% based on these researched projections. While the payback period extends beyond the initial 5-year window, the steady climb in annual revenue to $4.17 million by Year 5 builds significant long-term equity and asset value.
The unit hits its monthly break-even point in April 2026, roughly four months after opening its doors to guests. This milestone depends heavily on maintaining high occupancy for the extended stay rooms, which are projected to generate $780,000 in the first partial year of trading.
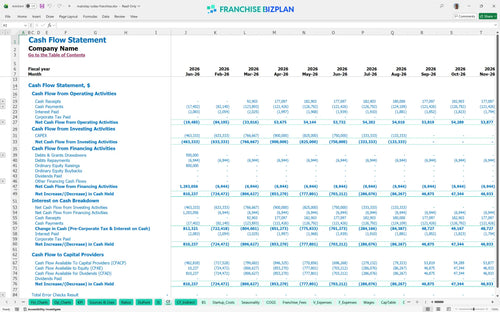
The lowest cash point occurs in August 2026, with a projected deficit of $3,427,000 during the construction and ramp-up phase. You will defintely need a robust financing plan or cash reserve to navigate the period between heavy CAPEX spending and stabilized revenue from corporate housing business model contracts.
Switching between Low, Medium, and High scenarios drastically alters your peak cash need and Year 1 margin for the franchise unit. For instance, a 10% drop in transient room rates could delay break-even by several months, while hitting the High case through better corporate sales could push Year 5 EBITDA well past the $2 million mark.
This hotel business plan spreadsheet is fully customizable in Excel, allowing you to tweak every variable from room rates to labor hours. Pre-filled formulas and editable assumptions make it easy to adapt to your specific market, whether you are in a tech hub or a suburban corridor, so you can see the impact of local demand on your bottom line.

Planning for an extended stay hotel franchise requires a multi-year view to account for the ramp-up of corporate contracts and guest loyalty. This model provides 5-year revenue, cost, and cash flow projections, helping you visualize the path from initial construction to stabilized operations and long-term profitability analysis.

The model captures specific financial obligations like the $30,000 initial franchise fee and ongoing 5% royalty payments. By including the 2.5% marketing fund contribution, you can see exactly how much brand support impacts your store-level margin before you ever break ground on the property.

Estimating the total initial investment is critical, especially with leasehold improvements hitting $2,500,000 and furniture and fixtures at $1,200,000. This tool helps you pinpoint the exact sales volume needed to cover your $25,000 monthly rent and other fixed overheads, providing a clear hotel development startup costs breakdown.

We include built-in franchise and industry benchmarks to help you verify if your housekeeping supply costs, starting at 4.5% of revenue, align with typical midscale hotel performance. Use these metrics to compare your projected store-level EBITDA against established hospitality standards to ensure your unit profitability analysis is realistic.


Simply purchase and download the financial model template, then access it instantly using Microsoft Excel or Google Sheets. No installation or technical expertise required-just open and start working.

Enter your business-specific numbers, including revenue projections, costs, and investment details. The pre-built formulas will automatically calculate financial insights, saving you time and effort.

Leverage the investor-ready format to confidently showcase your financial projections to banks, franchise representatives, or investors. Impress stakeholders with clear, data-driven insights and professional reports.

Leverage the investor-ready format to confidently present your projections to banks, franchise representatives, or investors.