
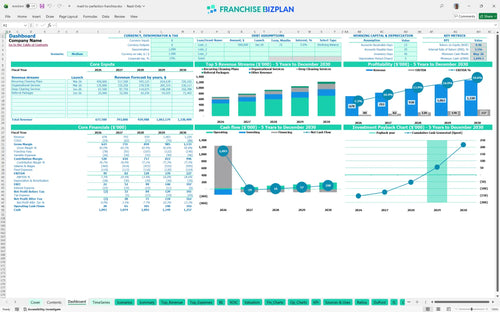
All-in-one Dashboard
Core inputs and core outputs


This Excel template for franchise unit financial forecasting includes pre-built tabs for revenue drivers, payroll, CAPEX, and a complete set of 5-year financial statements.
Core inputs and core outputs
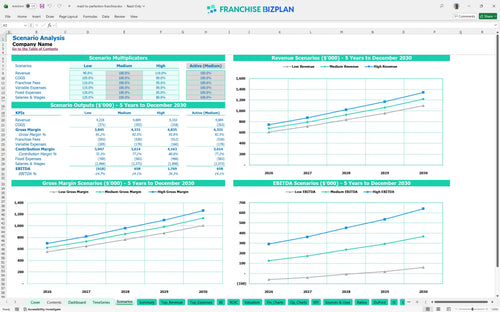
Three scenario analysis
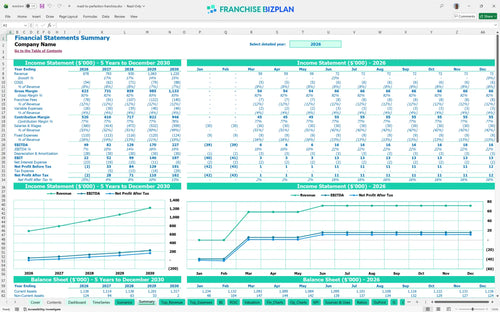
Presentation ready
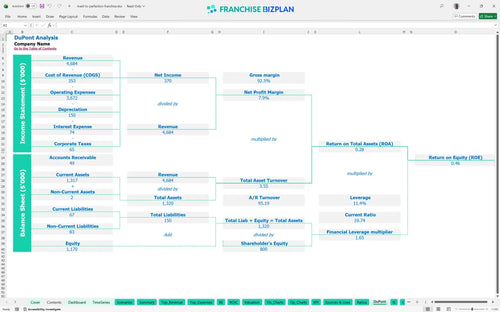
DuPont analysis
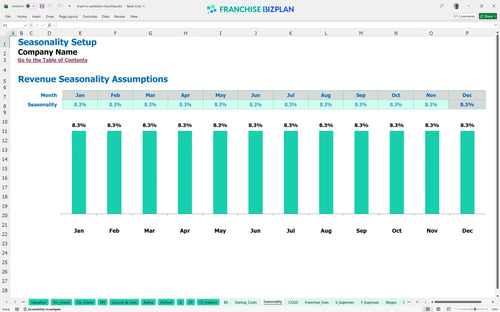
Researched revenue assumptions
Lender-friendly financial outputs
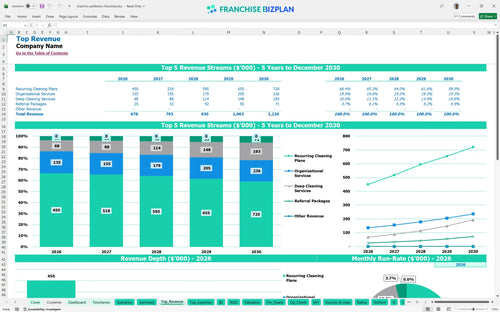
Revenue stream detailed view
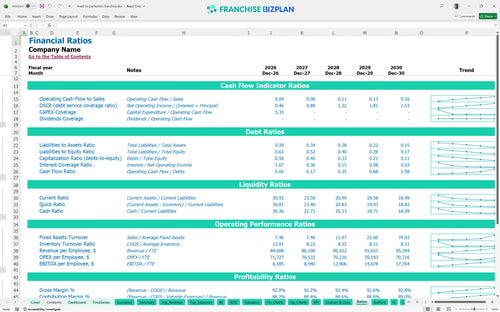
Performance metrics benchmark
We built this franchise unit financial model using our own research into high-end residential service models. Key assumptions like the $678,000 Year 1 revenue and the 7% royalty fee are pre-populated and fully editable to match your specific territory. It is a realistic look at how the $49,000 Year 1 EBITDA (earnings before interest, taxes, depreciation, and amortization) scales as you add more cleaning crews.
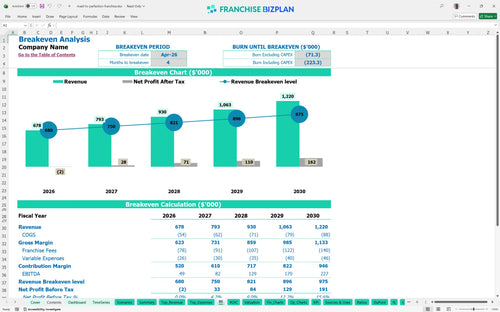
The franchise unit is projected to reach profitability in its first year, generating $49,000 in EBITDA. While Year 1 margins are modest, the net profit grows significantly as revenue hits $1,220,000 by Year 5. Here is the quick math: as you scale from 5 to 9 cleaning crew members, your fixed costs like the $4,800 rent are spread across a much larger revenue base.
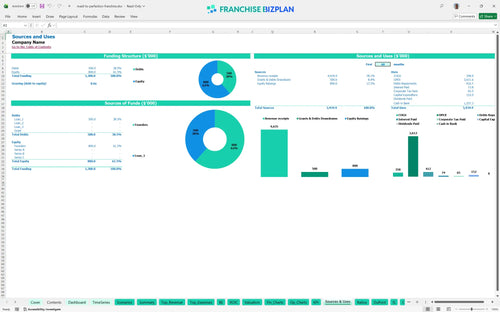
You will need approximately $152,000 to launch this franchise unit in the US market. This covers the $15,000 franchise fee, $40,000 for hub leasehold improvements, and $40,000 for branded service vehicles. The model also accounts for $20,000 in cleaning equipment and an initial $12,000 supplies inventory to ensure you are ready for day one.
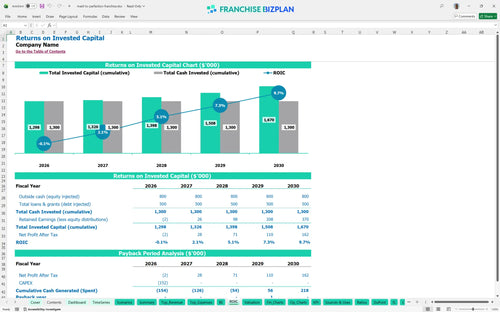
Investors can expect an Internal Rate of Return (IRR) of 3.47% and a Return on Equity (ROE) of 0.46 over the initial five-year period. The payback period is estimated at 4 years, which is standard for a service-based franchise with significant upfront vehicle and equipment costs. Still, the cash flow becomes much more attractive once the initial debt or investment is recovered.
The unit reaches its monthly break-even point in April 2026, just 4 months after launching. To cover the $4,800 monthly rent and the $130,000 in combined management salaries, you must maintain high utilization of your cleaning crews. Labor is your biggest lever; if your crew productivity dips, your break-even point will defintely push further out.
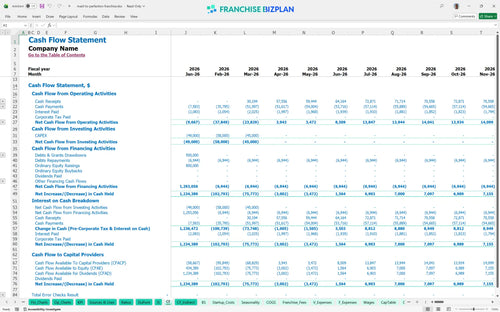
The lowest cash point occurs in May 2026, with a minimum cash balance of $1,049,000 suggested to handle the initial ramp-up and CAPEX (capital expenditures). This model assumes you have a significant buffer to handle the timing gaps between paying your crew and receiving client payments. You will need about 4 months of runway to safely navigate the pre-revenue and early growth phases.
In a High scenario, increasing your average ticket for organizational services can push Year 1 EBITDA well above the $49,000 baseline. Conversely, a Low scenario where recurring plans grow 20% slower would extend the 4-year payback period and increase peak cash needs. The model shows that Year 1 margins are sensitive to labor efficiency, so keeping your crew busy is the top priority.
Finance: update unit break-even and payback model by Friday.
This franchise financial model template is built entirely in Excel, giving you full control over every calculation and assumption. You can easily tweak the pre-filled formulas to match your specific territory or local market conditions without needing a degree in finance. It is designed to be a living document that grows with your business from the first hire to the fifth year of operation. Honestly, a model is only as good as its inputs, so we made sure everything is editable.

Planning for a cleaning business startup costs requires a multi-year view to understand when the initial heavy lifting pays off. This model provides detailed 5-year projections for revenue, expenses, and cash flow, allowing you to see the transition from a single crew to a multi-unit operation. By Year 5, the model shows revenue reaching $1,220,000, which helps in visualizing the long-term scalability of the concept. Mapping out the future helps you stay ahead of hiring needs and equipment cycles.

Understanding franchise royalty and marketing fees is critical because these 'off-the-top' costs directly impact your store-level margin. This tool automatically calculates the 7% royalty and 4.5% marketing fee against your projected sales, so you know exactly what is left for local overhead. It also accounts for the initial $15,000 franchise fee in your startup capital requirements. Seeing these numbers clearly prevents any surprises when the franchisor sends the first invoice.

How to calculate startup costs for a cleaning franchise becomes simple when you categorize every expense from leasehold improvements to initial inventory. This model tracks your $152,000 total initial investment and identifies the exact sales volume needed to cover your $4,800 monthly rent and other fixed costs. Knowing your break-even point helps you manage stress during those first few months of operation. Every dollar of margin you save during the ramp-up phase shortens your path to profitability.

We have integrated cleaning industry profit margins and labor benchmarks to help you sanity-check your projections against real-world performance. If your cleaning crew wages deviate too far from the projected $28,000 per FTE (full-time equivalent), the model will highlight the impact on your bottom line. This allows you to compare your expected performance against typical franchise unit financial performance template standards. Using these benchmarks ensures your business plan stays grounded in reality rather than optimism.


Simply purchase and download the financial model template, then access it instantly using Microsoft Excel or Google Sheets. No installation or technical expertise required-just open and start working.

Enter your business-specific numbers, including revenue projections, costs, and investment details. The pre-built formulas will automatically calculate financial insights, saving you time and effort.

Leverage the investor-ready format to confidently showcase your financial projections to banks, franchise representatives, or investors. Impress stakeholders with clear, data-driven insights and professional reports.

Leverage the investor-ready format to confidently present your projections to banks, franchise representatives, or investors.