
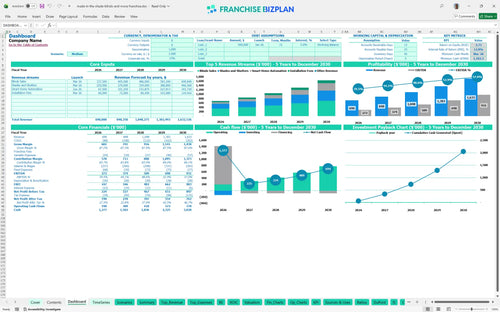
All-in-one Dashboard
Core inputs and core outputs


This comprehensive toolkit provides a fully integrated Excel workbook featuring 5-year projections, startup cost calculators, and detailed unit economics for a mobile service business.
Core inputs and core outputs
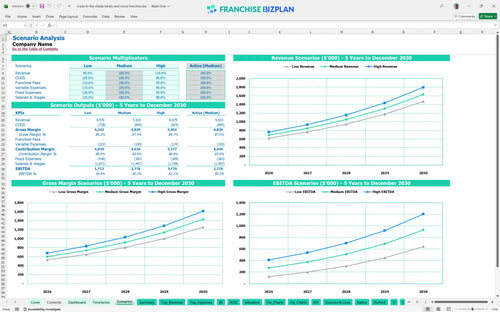
Three scenario analysis
Presentation ready
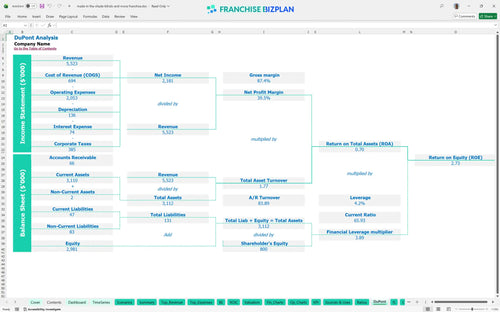
DuPont analysis
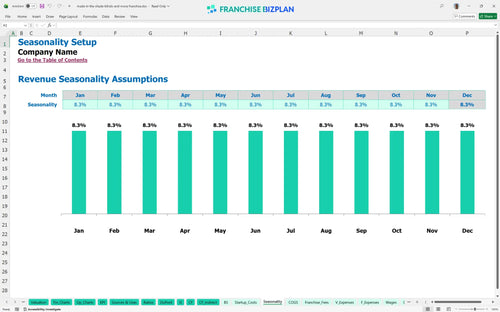
Researched revenue assumptions
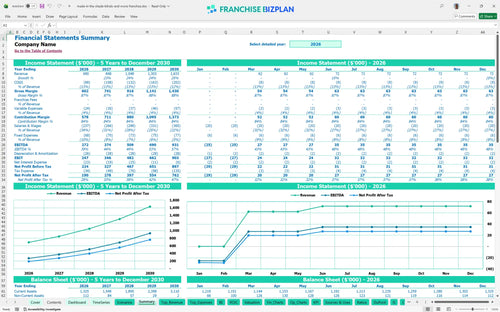
Lender-friendly financial outputs
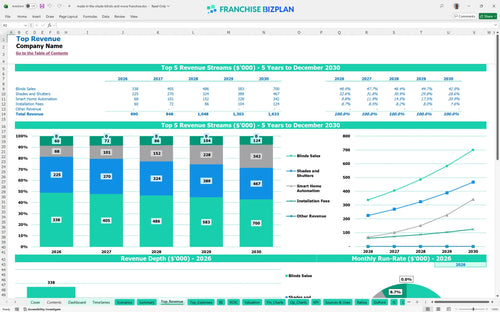
Revenue stream detailed view
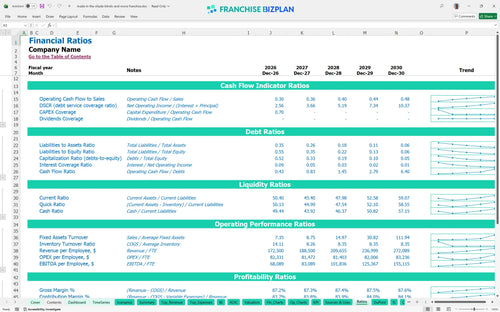
Performance metrics benchmark
We developed this home service franchise financial projection using detailed research into mobile showroom operations and high-end window treatment markets. The model includes pre-filled data for a window treatment franchise business plan, showing Year 1 revenue of $690,000 and an EBITDA (earnings before interest, taxes, depreciation, and amortization) of $272,000 to give you a realistic starting point. All assumptions, from the $1,200 monthly vehicle lease to the $68,000 sales consultant salary, are fully editable to match your local Austin or Westlake market conditions.
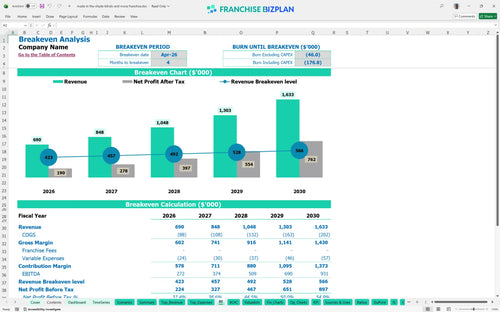
This window treatment franchise unit hits profitability quickly, reaching its monthly break-even point in just 4 months. With Year 1 revenue projected at $690,000 and EBITDA at $272,000, the model shows a strong start for a well-managed territory. You will defintely need to track material costs closely, as they represent the largest chunk of your direct expenses. Speed to profit is the primary advantage of this mobile-first model.
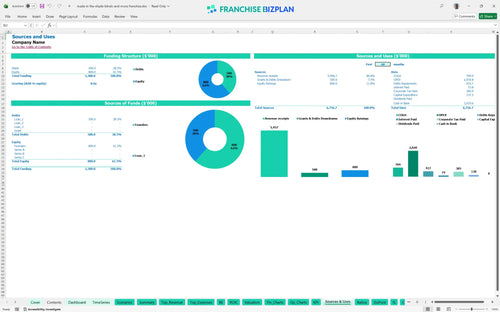
You need a significant initial investment, but it is heavily weighted toward brand access and mobile infrastructure rather than real estate. The total startup capital includes a $67,500 franchise fee and $35,000 for a mobile showroom vehicle to serve the Lake Travis area. Total minimum cash reaches $1,102,000 by March 2026 to ensure you have a massive safety net during the launch. Your vehicle is your storefront, so invest in the signage early.
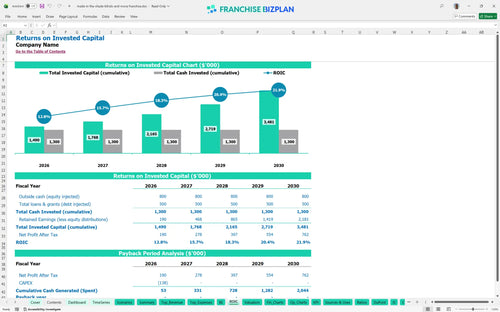
Investors can expect a 12.8% internal rate of return, though full payback on the total cash outlay takes over five years due to the high initial cash buffer. The model shows a 2.73 return on equity (ROE), which is solid for a service-based business with low fixed overhead. Honestly, the long payback period reflects the conservative $1.1 million cash reserve rather than poor unit margins. High margins sustain the 12.8% IRR over the long haul.
Break-even occurs in April 2026, just four months after launching operations in the Silicon Hills region. This rapid break-even is driven by low overhead since there is no rent for a physical store, but you still have about $6,000 in monthly fixed costs. You can use this window treatment business cash flow projection template to see how volume affects your timeline. Low fixed costs make the path to break-even much shorter.
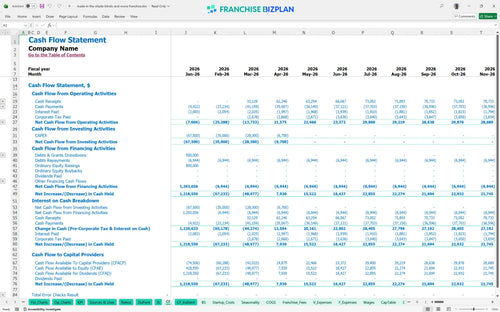
The lowest cash point hits in March 2026, requiring a disciplined approach to spending during the first 90 days of the ramp-up. With an operating expenses spreadsheet, you can track the $2,200 monthly marketing spend and ensure it generates enough leads. To protect cash flow, you might phase the hiring of the Sales Install Crew or delay the $4,200 computer spend. Cash is your oxygen during the ramp-up phase.
Performance varies wildly based on local marketing execution and your ability to sell high-margin automation systems. In the high-growth scenario, smart home automation sales can scale from $45,000 in Year 1 to over $227,000 by Year 5. This financial projection tool for interior design service franchise owners helps you see how a 10% drop in volume impacts your Year 1 margin. Upselling automation is the fastest way to the high-case scenario.
This franchise financial model template is a fully customizable Excel framework designed to map out your mobile business financial model with precision. You can easily adjust the pre-filled formulas and editable assumptions to fit your specific territory, whether you are launching a single unit or a small chain. It is a defintely a flexible financial model template for home-based franchise business owners who need to pivot assumptions as local demand shifts.

You can build a comprehensive revenue forecasting model that tracks long-term growth and uses an Excel template for franchise unit financial planning. This tool projects your performance through Year 5, where revenue is estimated to reach $1,633,000 based on scaling your installation and sales capacity. It provides a clear view of your long-term profitability and cash flow needs as the business matures.

Managing your franchise startup cost spreadsheet is simple with dedicated inputs for the initial fee and ongoing brand obligations. While this specific model reflects a 0% royalty and marketing fee structure, the framework allows you to toggle these costs if brand standards change. It captures the real economics of your store-level margin by accounting for every dollar sent to the franchisor.

This tool shows you how to calculate startup costs for a window blind franchise and provides a clear path to your break-even point. You can use it to estimate the total initial investment, including the $67,500 franchise fee and the $35,000 mobile showroom vehicle. It helps you understand how to build a budget for a new franchise location without the overhead of a traditional storefront.

Use built-in profitability analysis to compare your unit's performance against standard home service benchmarks for labor and gross margins. The model includes researched data on window treatment materials, which run approximately 11% of sales, helping you sanity-check your COGS (cost of goods sold). This ensures your financial projections stay grounded in the reality of day-to-day franchise operations.


Simply purchase and download the financial model template, then access it instantly using Microsoft Excel or Google Sheets. No installation or technical expertise required-just open and start working.

Enter your business-specific numbers, including revenue projections, costs, and investment details. The pre-built formulas will automatically calculate financial insights, saving you time and effort.

Leverage the investor-ready format to confidently showcase your financial projections to banks, franchise representatives, or investors. Impress stakeholders with clear, data-driven insights and professional reports.

Leverage the investor-ready format to confidently present your projections to banks, franchise representatives, or investors.