
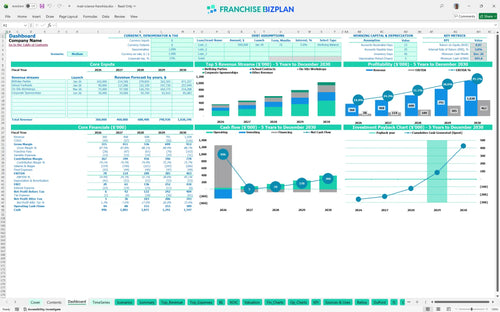
All-in-one Dashboard
Core inputs and core outputs


This franchise unit financial model provides a comprehensive toolkit for analyzing the startup costs, operational margins, and five-year growth potential of a mobile-enhanced STEM education business.
Core inputs and core outputs
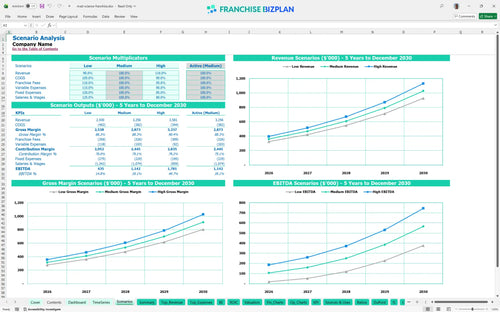
Three scenario analysis
Presentation ready
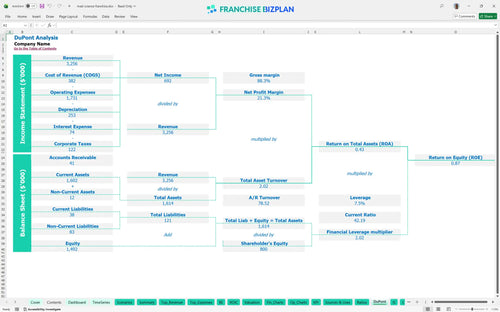
DuPont analysis
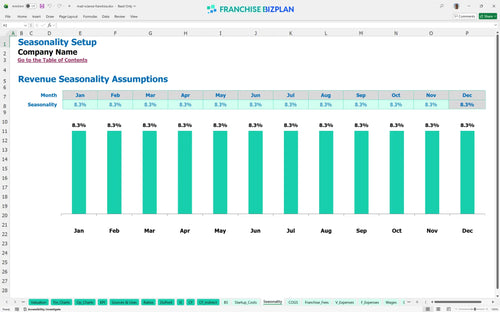
Researched revenue assumptions
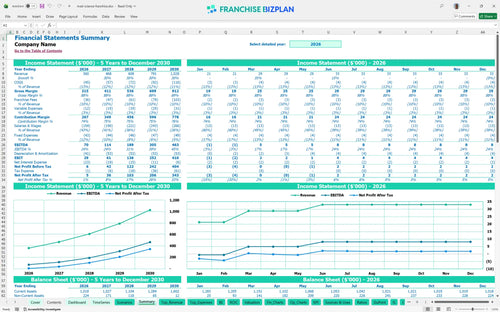
Lender-friendly financial outputs
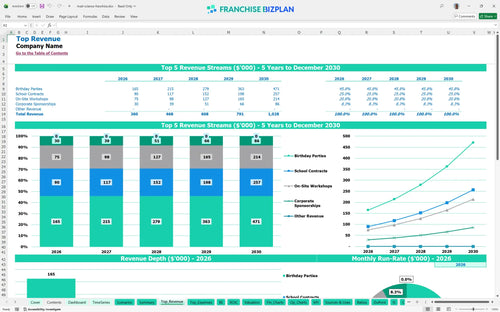
Revenue stream detailed view
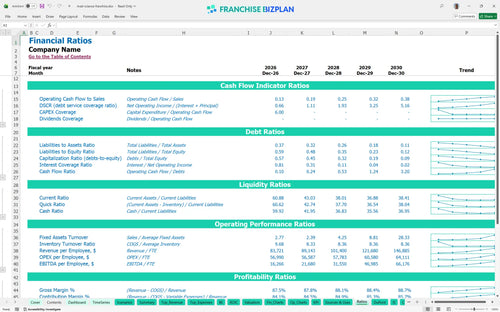
Performance metrics benchmark
We built this franchise unit financial model using our own research into the children's enrichment sector and mobile service economics. Key assumptions like the $360,000 Year 1 revenue and $70,000 EBITDA are pre-populated with researched data and are fully editable to match your specific territory. This tool allows you to stress-test the viability of school contracts and birthday party revenue against fixed costs like modular space rent.
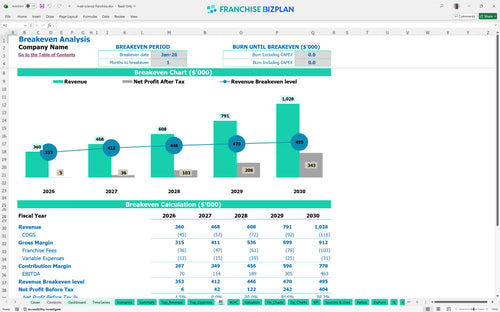
The unit shows immediate operational viability with a break-even date of January 2026, just one month after launch. By Year 5, EBITDA is projected to reach $463,000 as you scale from $360,000 in initial annual sales to over $1 million. Efficiency is the name of the game here.
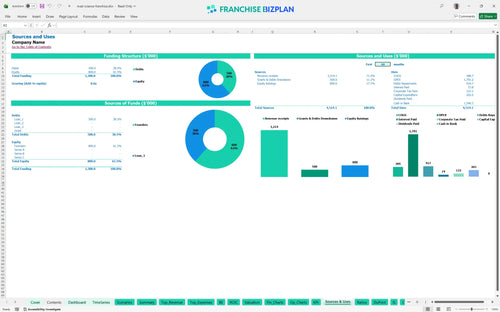
You will need approximately $265,000 in initial capital to cover the $25,000 franchise fee, $70,000 in leasehold improvements, and $50,000 for the lab setup. This total also accounts for mobile units and STEM equipment necessary to service both on-site workshops and school contracts. Having a clear view of these startup costs ensures you don't run out of steam before the first party.
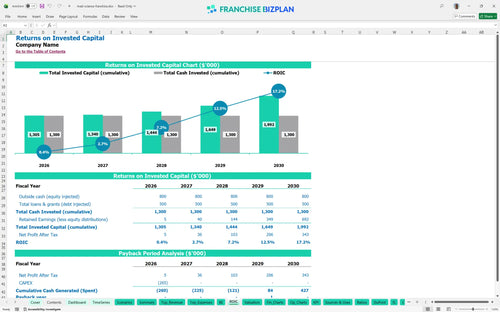
This investment offers an Internal Rate of Return (IRR) of 3.75% and a Return on Equity (ROE) of 0.87 over the five-year period. You can expect a payback period of 4 years, which is standard for a service-based model with significant upfront equipment and build-out costs. It's a steady climb, but the cash flow maturity in later years is the real prize.
The model hits the break-even point in month one, meaning revenue quickly covers the $4,100 in monthly fixed costs like rent and insurance. The biggest lever for staying above water is the volume of birthday parties, which starts at $110,000 annually and represents the highest-margin revenue stream. Watch your labor costs closely, as they are your biggest variable hurdle.
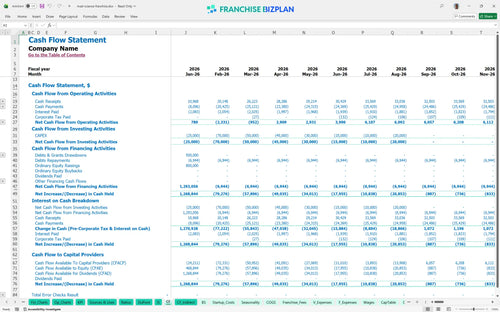
The minimum cash balance is projected at $996,000 in December 2026, providing a massive safety net for operations. While the model shows a strong start, maintaining this runway requires disciplined spending on lab maintenance and keeping transportation costs around 2% of sales. Cash is king, especially when you're managing multiple mobile units.
Moving from a medium to a high-growth scenario involves scaling your instructor team from 2.0 to 4.0 full-time equivalents to handle increased demand. In the high case, revenue jumps from $360,000 to over $1 million by Year 5, significantly boosting your store-level margin. Success defintely depends on how well you execute local marketing to fill the workshop calendar.
Finance: update unit break-even and payback model by Friday
This franchise unit financial model is a fully customizable Excel tool designed to handle the specific unit economics of a children's education business. It features pre-filled formulas and editable assumptions, allowing you to adjust everything from local rent to instructor wages to see how they impact your bottom line. It's the fastest way to see how a small change in birthday party pricing impacts your profit.

Planning for the long term is essential when scaling a STEM education franchise business plan. This model provides detailed 5-year projections for revenue, costs, and cash flow, helping you visualize the transition from a single-unit startup to a mature, profitable operation. You can track how increasing your instructor headcount supports higher volumes of school contracts over time.

Operating within a brand system means managing specific financial obligations that can squeeze margins if not tracked correctly. This model captures the initial franchise fee, the 8% royalty, and the 2% marketing fund contribution to show you the true net income after franchisor costs. Understanding these 'off-the-top' expenses is vital for maintaining a healthy store-level margin.

Using a franchise startup cost calculator helps you avoid the common trap of undercapitalization during the ramp-up phase. This section breaks down the total initial investment, including leasehold improvements and lab equipment, and calculates the exact sales volume needed to cover your monthly fixed costs. Knowing your number helps you manage expectations during the first few months of trading.

This model incorporates children's education franchise model benchmarks to help you sanity-check your operating assumptions against industry standards. You can compare your projected labor costs and science material expenses (currently around 10.5%) to ensure your unit is performing within a competitive range. It's a reality check for your financial forecasting.


Simply purchase and download the financial model template, then access it instantly using Microsoft Excel or Google Sheets. No installation or technical expertise required-just open and start working.

Enter your business-specific numbers, including revenue projections, costs, and investment details. The pre-built formulas will automatically calculate financial insights, saving you time and effort.

Leverage the investor-ready format to confidently showcase your financial projections to banks, franchise representatives, or investors. Impress stakeholders with clear, data-driven insights and professional reports.

Leverage the investor-ready format to confidently present your projections to banks, franchise representatives, or investors.