
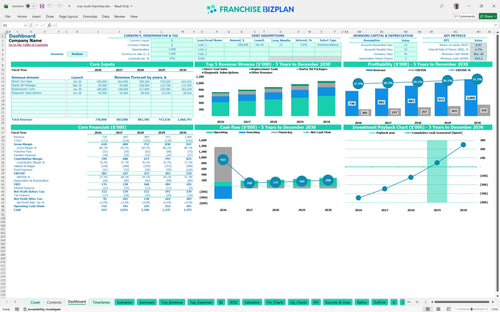
All-in-one Dashboard
Core inputs and core outputs


This comprehensive mobile tool franchise business plan spreadsheet provides a data-driven roadmap for managing a high-visibility tool truck territory with professional-grade precision.
Core inputs and core outputs
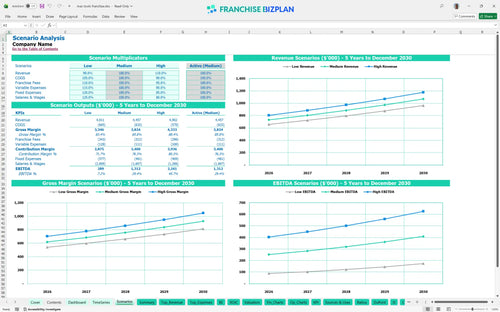
Three scenario analysis
Presentation ready

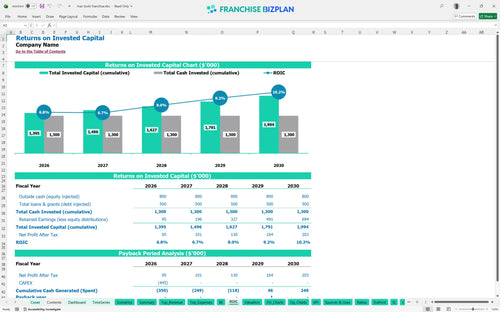
DuPont analysis
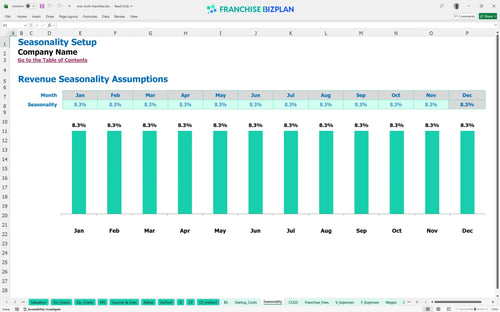
Researched revenue assumptions
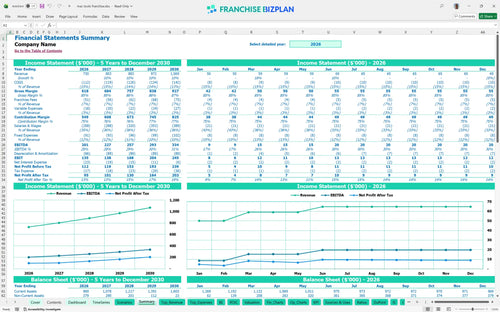
Lender-friendly financial outputs
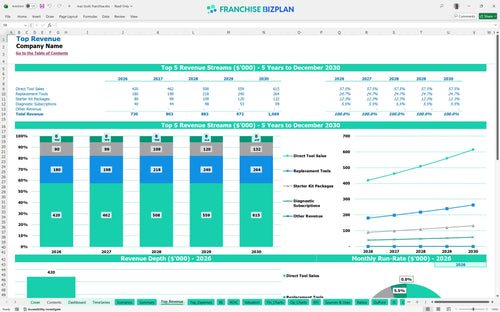
Revenue stream detailed view
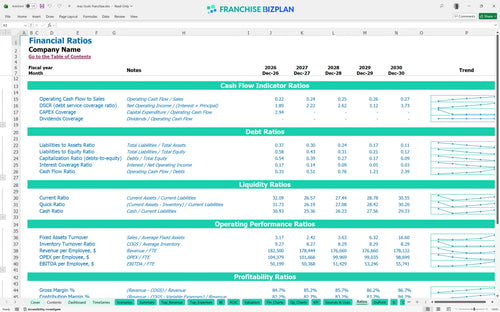
Performance metrics benchmark
We built this mobile tool franchise financial model template using deep research into the automotive tool distribution business. Key assumptions like your $225,000 mobile showroom truck, 5% royalty fees, and revenue streams from diagnostic subscriptions are pre-populated and fully editable to match your specific territory. With year-one revenue projected at $730,000 and EBITDA at $201,000, this tool helps you manage the day-to-day realities of a high-volume route.
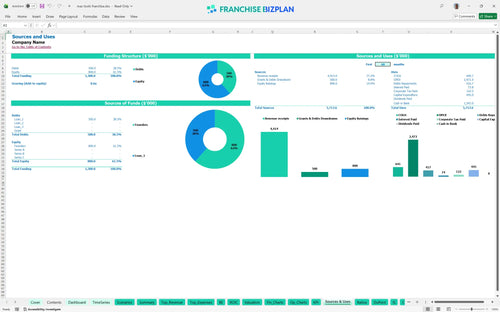
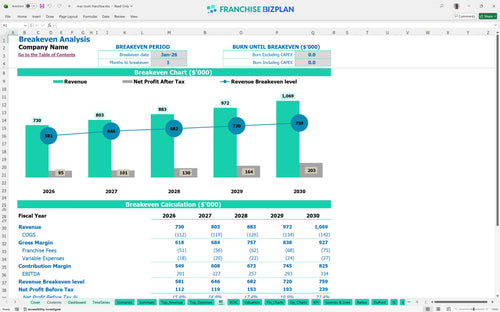
The unit hits its monthly break-even point almost immediately in January 2026, thanks to the high demand for direct tool sales and starter kits. While EBITDA starts strong at $201,000 in the first year, true net profitability accounts for the 5% royalty and 2% marketing fees that scale with your growth.
You will need a substantial initial investement to get the truck on the road, with the mobile showroom and initial inventory being the largest hurdles. The total setup includes an $8,000 franchise fee, $225,000 for the truck, and $120,000 for the first round of inventory stock to ensure you can fulfill orders on day one.
The model forecasts a 4-year payback period for the initial capital outlay, which is standard for high-CAPEX mobile franchises. With an Internal Rate of Return (IRR) of 3.66% and a Return on Equity (ROE) of 0.87, the focus is on long-term equity building through territory dominance and recurring subscription revenue.
The unit reaches break-even in month one, but staying there requires managing $2,200 in monthly vehicle maintenance and fuel plus $1,300 for warehouse storage. The primary driver for hitting these numbers is consistent weekly traffic and maintaining a high average ticket across your diesel and restoration shop clients.
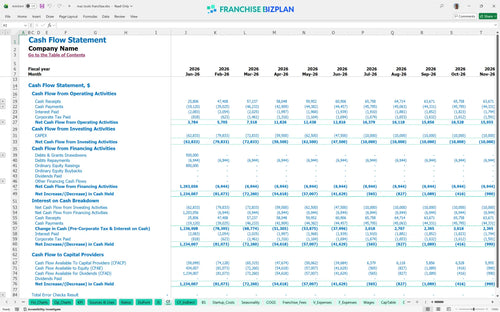
The lowest cash point is projected at $923,000 in December 2026, defintely showing that while the unit is profitable, inventory and equipment debt service can tighten liquidity. You should maintain a cash buffer to handle the timing gaps between tool procurement and customer payments on the route.
In a high-growth scenario, scaling revenue from $730,000 to $1,069,000 by year five significantly improves your EBITDA margin from 27% to 31%. The model shows that even in lower-performing years, the fixed cost of the owner-operator salary ($85,000) remains the largest overhead item to manage against tool margins.
Finance: update unit break-even and payback model by Friday.
This franchise unit financial model is fully customizable in Excel, featuring pre-filled formulas and editable assumptions that allow you to adapt the tool truck business plan to your specific territory and local demand. Whether you are adjusting for Houston's diesel corridors or smaller industrial parks, the logic stays intact for precise planning.

Success in the automotive tool distribution business requires looking past the first year of route development. This model provides detailed 5-year projections for revenue, costs, and cash flow, helping you visualize how scaling from $730,000 in year one to over $1 million in year five impacts your bottom line and store-level margin.

The model captures specific financial obligations like the 5% royalty and 2% marketing fund contribution to show the real economics of your mobile tool franchise business plan. By factoring these in alongside your $8,000 initial franchise fee, you get a clear view of the net cash available after the franchisor takes their cut.

Launching a tool truck requires significant upfront capital, particularly for the mobile showroom and initial stock. This franchise startup cost calculator helps you estimate the total investment needed to cover the $225,000 truck and $120,000 in inventory, ensuring you know exactly when your sales volume will finally cover your fixed costs.

We have integrated industry-standard benchmarks for mobile franchise profitability analysis, allowing you to sanity-check your inventory costs and labor spend. If your tool inventory costs deviate significantly from the 13.5% benchmark in year one, the model flags it so you can adjust your procurement or pricing strategy accordingly.


Simply purchase and download the financial model template, then access it instantly using Microsoft Excel or Google Sheets. No installation or technical expertise required-just open and start working.

Enter your business-specific numbers, including revenue projections, costs, and investment details. The pre-built formulas will automatically calculate financial insights, saving you time and effort.

Leverage the investor-ready format to confidently showcase your financial projections to banks, franchise representatives, or investors. Impress stakeholders with clear, data-driven insights and professional reports.

Leverage the investor-ready format to confidently present your projections to banks, franchise representatives, or investors.