
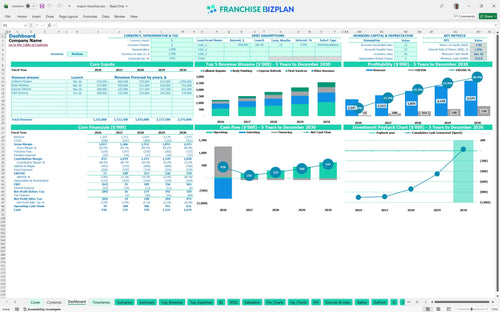
All-in-one Dashboard
Core inputs and core outputs


This financial model for multi-bay auto repair facility provides a complete roadmap for estimating profitability for automotive repair franchises by integrating startup costs, operational expenses, and multi-stream revenue forecasts into one dynamic spreadsheet.
Core inputs and core outputs
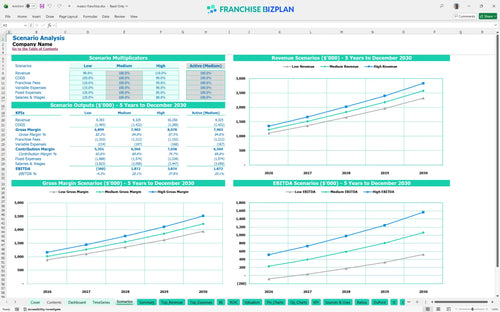
Three scenario analysis
Presentation ready
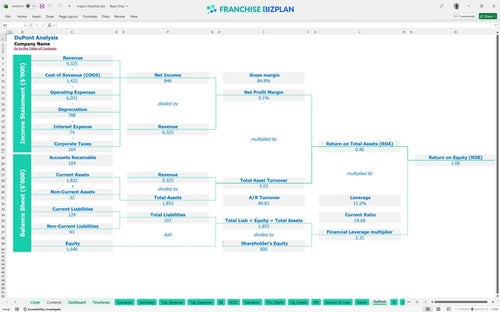
DuPont analysis
Researched revenue assumptions
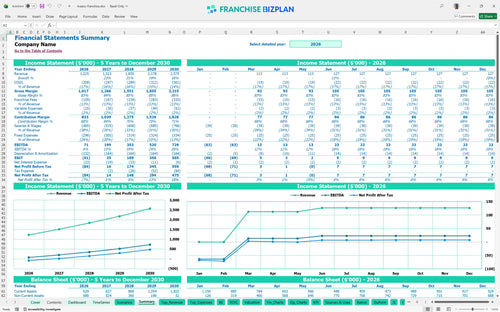
Lender-friendly financial outputs
Revenue stream detailed view
Performance metrics benchmark
We built this franchise unit financial model using deep research into the collision repair industry and typical brand standards. Key assumptions like the $45,000 initial fee, multi-bay staffing needs, and revenue streams from fleet services are pre-populated but fully editable. This ensures you have a credible starting point for your franchise unit profitability analysis without starting from scratch. We focus on the $1.2M to $2.5M revenue ramp-up to show you what a mature unit looks like.
The model shows the shop hitting a positive EBITDA of $71,000 in the first year, scaling significantly as volume grows. By year three, earnings reach $353,000 as the 'Express Refresh' and fleet segments mature. Profitability depends on keeping paint waste low and technician productivity high across all bays. Speed in the bays is the secret to a healthy bottom line.
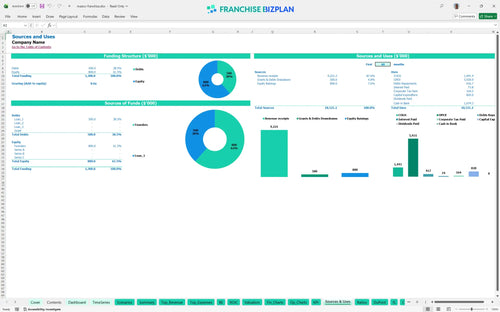
You will need significant capital to get the doors open, with leasehold improvements and equipment making up the bulk of the spend. The total initial investment covers everything from the $45,000 franchise fee to the $120,000 paint booth installation. We also factored in $80,000 for initial inventory to ensure you have the parts and paint needed for day-one repairs. Build-out is always the biggest cash drain.
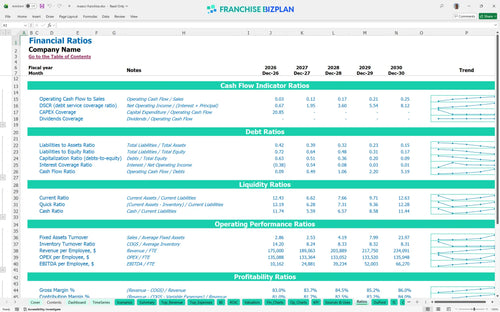
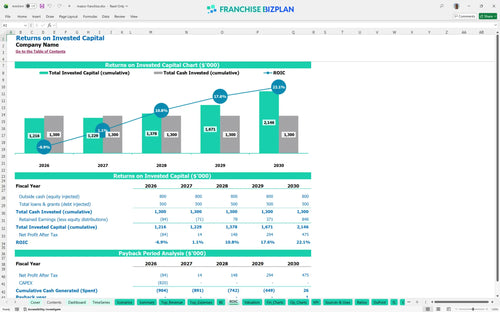
This model projects a 5-year payback period, which is standard for a heavy capital expenditure planning automotive business. With an IRR of 1.83% and an ROE of 1.06, the focus is on long-term equity building rather than a quick flip. As revenue scales toward $2.5M, the net margin improves, making the franchise ROI calculation much more attractive for serious operators. Automotive is a marathon, not a sprint.
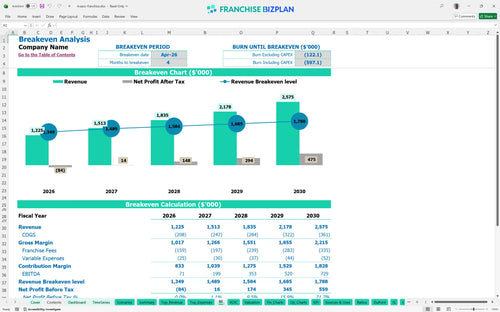
You reach the monthly break-even point in April 2026, just four months after the January start. The biggest hurdle is covering the $15,000 monthly rent and the $24,000+ monthly base payroll for your lead painter and techs. This break-even analysis for vehicle restoration business shows that success is all about throughput-getting cars in and out of the paint booth fast. Every empty bay is lost money.
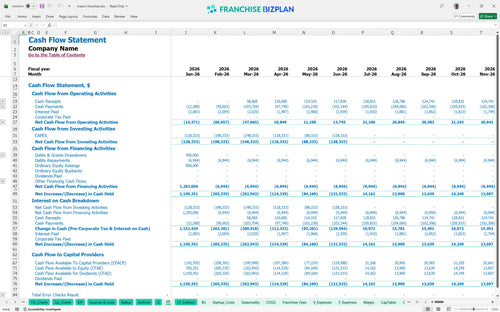
Your lowest cash point is $352,000 in June 2026, which happens after the final build-out payments and initial inventory stock-up. You need enough runway to survive the first few months while insurance companies process claims and fleet accounts settle their bills. Honestly, having a buffer is smart because one delay in equipment delivery can push your revenue start date back, and you defintely want to avoid that. Cash flow management for automotive service franchises is about timing.
The difference between a high-performing shop and a struggling one often comes down to local marketing and fleet retention. In a high-growth scenario, hitting $2.5M in sales by year five creates a massive $729,000 EBITDA, but a low-volume scenario makes the $15,000 rent very heavy. This model lets you toggle these scenarios to see how commercial fleet maintenance revenue forecasting changes your ability to pay your lead painter. Real-world results vary, so plan for the dip.
Finance: update unit break-even and payback model by Friday.
This auto body shop franchise model is a fully customizable Excel tool that lets you swap out every assumption to match your specific market. You can adjust the number of bays, technician headcounts, and paint material costs to see how they impact your bottom line. It is an auto body shop financial projection excel template built for real-world testing, so you can model different bay efficiencies or local labor rates without breaking the math. This franchise investment feasibility study template makes it easy to adapt to a specific location and operating scenario. Every bay you add changes the math, so we made it flexible.

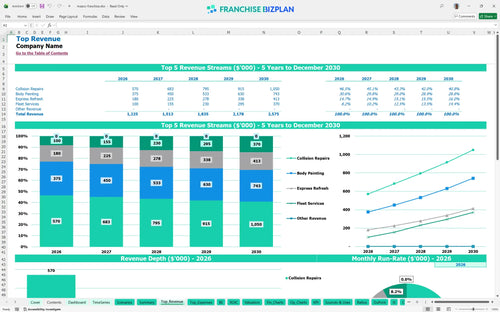
We mapped out a 5-year path where revenue climbs from $1.22M in year one to over $2.5M by year five. This franchise financial model template tracks the transition from a new shop to a mature facility with optimized throughput. You will see how scaling fleet services and collision repair volume impacts your long-term automotive service center economics. These pro forma financial statements give you the long-range view needed for multi-unit planning. Growth is great, but only if the cash flow follows.

Running a major brand means paying for the name, and this model accounts for every cent of the 8% royalty and 5% marketing fee. At $1.5M in sales, that is $195,000 annually off the top, so predicting net income for auto repair franchise units requires precision. We have baked these fees into the cash flow so you can see the true store-level margin after corporate takes its cut. It is the only way to know if your local overhead is sustainable. Brand power costs money, so track it closely.

Launching a collision repair franchise business plan requires heavy upfront capital for things like paint booths and frame straighteners. Our model shows how to calculate startup costs for a collision repair franchise, including the $45,000 fee and $350,000 in leasehold improvements. Knowing your fixed costs-like the $15,000 monthly rent-helps you find the exact automotive repair franchise startup costs needed to reach safety. You cannot manage what you do not measure during build-out.

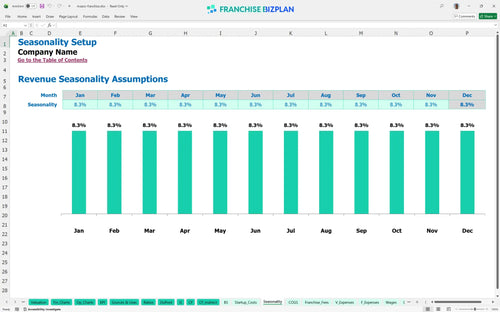
We use industry-standard percentages for paint supplies and body parts to keep your operational expense forecasting grounded in reality. For instance, paint and supplies start at 10.5% of sales and should drop to 8.5% as your team gets more efficient with materials. These benchmarks help you spot if you are overspending on consumables or if your labor-to-revenue ratio is out of whack compared to high-performing units. Efficiency in the paint booth is your biggest margin lever.


Simply purchase and download the financial model template, then access it instantly using Microsoft Excel or Google Sheets. No installation or technical expertise required-just open and start working.

Enter your business-specific numbers, including revenue projections, costs, and investment details. The pre-built formulas will automatically calculate financial insights, saving you time and effort.

Leverage the investor-ready format to confidently showcase your financial projections to banks, franchise representatives, or investors. Impress stakeholders with clear, data-driven insights and professional reports.

Leverage the investor-ready format to confidently present your projections to banks, franchise representatives, or investors.