
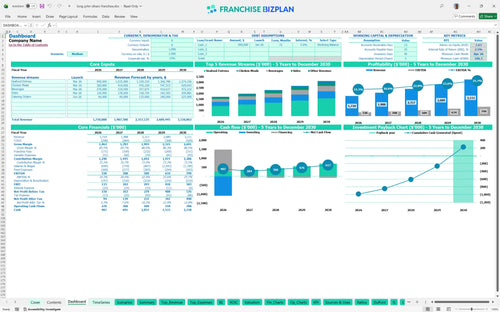
All-in-one Dashboard
Core inputs and core outputs


This restaurant franchise startup cost spreadsheet includes a franchise unit cash flow statement template, detailed payroll calculators, and a CAPEX (capital expenditure) tracker for kitchen and drive-thru equipment.
Core inputs and core outputs
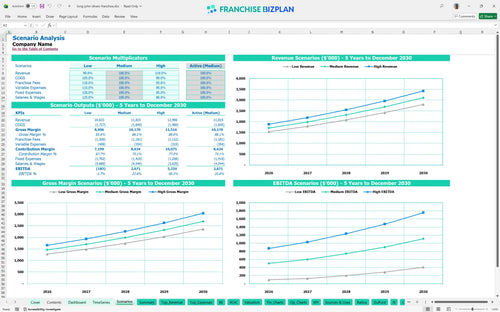
Three scenario analysis
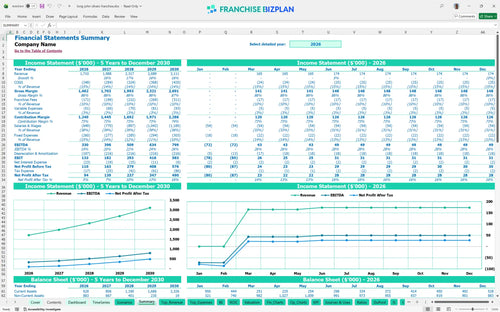
Presentation ready
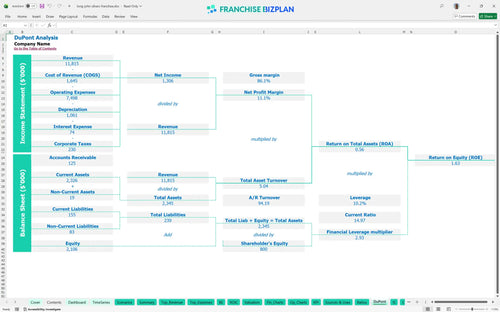
DuPont analysis
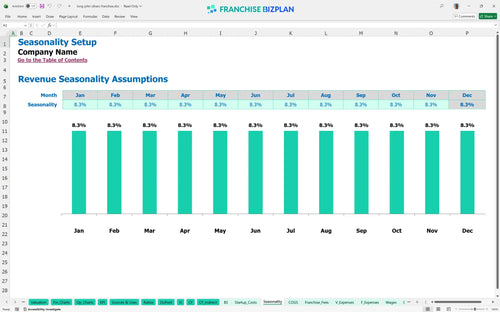
Researched revenue assumptions
Lender-friendly financial outputs
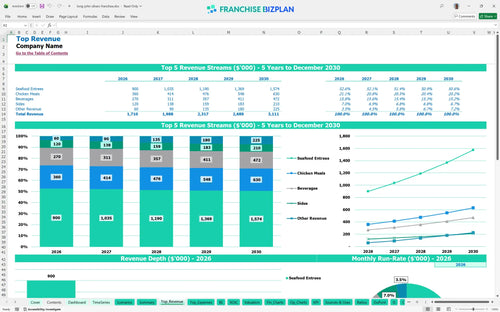
Revenue stream detailed view
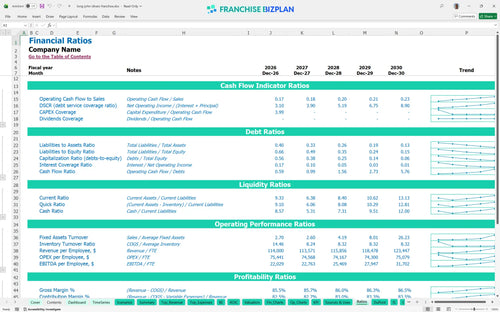
Performance metrics benchmark
We built this financial planning guide for new franchise locations using our own research into the seafood QSR sector. Key assumptions, including the $1.7M year-one revenue and the 10% combined royalty and marketing fees, are pre-populated with researched data specific to this franchise unit and are fully editable. This tool helps you see how the $16,000 monthly rent and $1.08M total capital investment impact your long-term wealth.
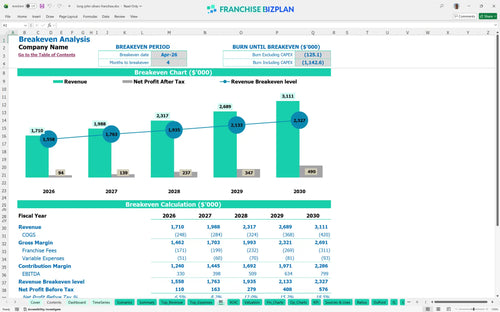
You can expect this seafood unit to hit its stride quickly, with the model showing a break-even date in April 2026. By year three, annual revenue is projected to climb to $2.3M with an EBITDA of $509,000, provided you manage the 12.5% food cost effectively. Profitability starts when the drive-thru stays busy. Here's the quick math: with $1.7M in year-one sales, you are looking at a $330,000 EBITDA after all fees.
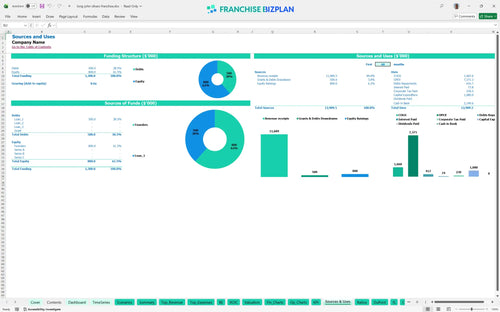
Launching this unit requires a total capital expenditure (funds used to acquire physical assets) of $1,080,000 plus a cash buffer. The largest outlays are the $450,000 for leasehold improvements and $200,000 for kitchen equipment. Your biggest check goes to the landlord's improvements. What this estimate hides: the timing of the $35,000 franchise fee and the $200,000 drive-thru infrastructure costs.
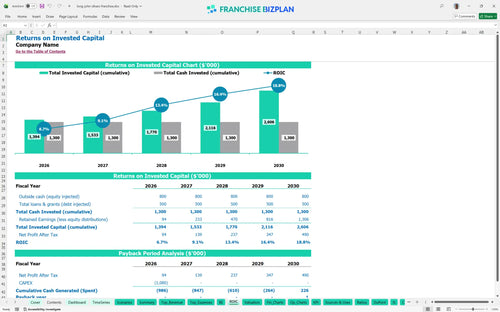
This restaurant franchise investment feasibility study projects a 5-year payback period with an Internal Rate of Return (IRR) of 2.52%. While the initial years focus on recovering the $1.08M investment, the Return on Equity (ROE) reaches 1.63 as the unit matures. ROI is a marathon, not a sprint. Estimating return on investment for restaurant franchises requires looking past the first 12 months of ramp-up losses.
Calculating break-even point for quick service restaurants is the first step to survival, and this unit hits it in month four. The biggest hurdle is the $16,000 monthly rent plus the $23,000 in monthly management and shift leader salaries. Fixed costs are the enemy of a slow month. You need to maintain high throughput in the dual-lane drive-thru to cover the 10% royalty and marketing burden.
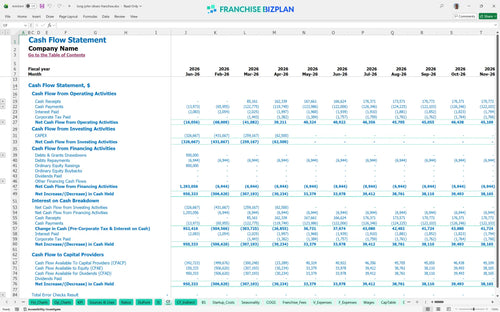
The lowest cash point occurs in April 2026, with a minimum cash balance of $106,000 during the initial ramp-up. You need enough working capital to survive the three-month build-out and the first few trading days. The franchise unit profitability analysis shows the lowest cash point is your danger zone. We defintely recommend keeping a 20% contingency fund to handle any delays in the drive-thru infrastructure setup.
The model allows you to toggle between Low, Medium, and High scenarios to see how a 10% drop in revenue affects your year-1 EBITDA. Operational efficiency metrics (measures of how well a business uses its resources) are key to hitting the high-growth scenario. Scenarios turn a static plan into a dynamic strategy. If opening takes 90+ days longer than planned, the High case becomes essential for recovery.
Finance: update unit break-even and payback model by Friday.
This franchise financial model template is built in Excel with open formulas and editable assumptions, so you can adapt it to any territory or site. You can adjust local rent, labor rates, and seafood costs to match your specific market reality. It simplifies complex QSR revenue forecasting (estimating future sales) by letting you tweak average ticket prices and traffic counts for seafood and chicken meals. Every cell is open for your local data.

This fast food franchise business plan tool provides a clear 5-year roadmap for your revenue, expenses, and cash flow. It is the financial model template for new franchise owners who need to see how scaling from one to multiple units affects the bottom line. You get a full QSR franchise financial projection excel sheet that maps out growth from $1.7M in year one to over $3.1M by year five. Five years is the horizon you need for real wealth.

The model tracks the 5% royalty and 5% marketing fee that come off the top of your gross sales every month. By accounting for these franchise royalty fees early, you get a clear picture of your store-level EBITDA (earnings before interest, taxes, depreciation, and amortization). This ensures you aren't surprised by the brand fund obligations that can squeeze your margins if traffic dips. Royalties are a top-line tax you must plan for.

Use this QSR franchise investment calculator to map out your initial $1.08M investment, including the $35,000 franchise fee and $450,000 in leasehold improvements. It helps you understand how to calculate startup costs for a fast food franchise while identifying the exact sales volume needed to cover your $16,000 monthly rent. Knowing your break-even point helps you manage the critical first few months of operation. Cash is king during the build-out phase.

We include best practices for forecasting restaurant franchise profitability by incorporating industry-standard metrics for labor and food costs. If your projected seafood margins are way off the 12% target, the model highlights the gap so you can adjust your unit economics analysis (the study of a single store's revenue and costs). This helps you sanity-check your assumptions against typical QSR performance ranges. Don't fly blind without knowing the industry norms.


Simply purchase and download the financial model template, then access it instantly using Microsoft Excel or Google Sheets. No installation or technical expertise required-just open and start working.

Enter your business-specific numbers, including revenue projections, costs, and investment details. The pre-built formulas will automatically calculate financial insights, saving you time and effort.

Leverage the investor-ready format to confidently showcase your financial projections to banks, franchise representatives, or investors. Impress stakeholders with clear, data-driven insights and professional reports.

Leverage the investor-ready format to confidently present your projections to banks, franchise representatives, or investors.