
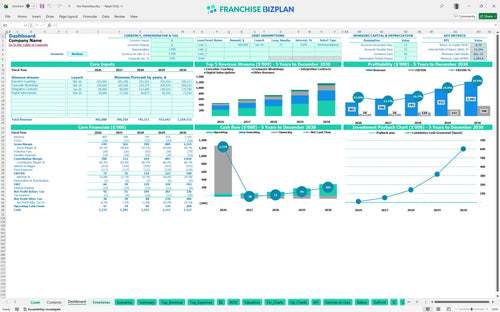
All-in-one Dashboard
Core inputs and core outputs


This franchise financial model template provides a complete toolkit to project revenue, manage payroll for a growing team, and track the ROI of your initial investment.
Core inputs and core outputs
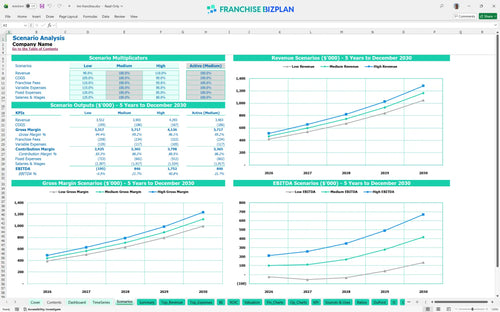
Three scenario analysis
Presentation ready
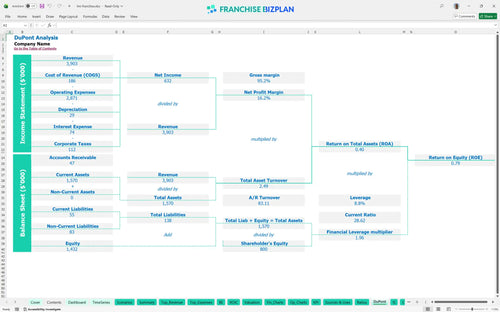
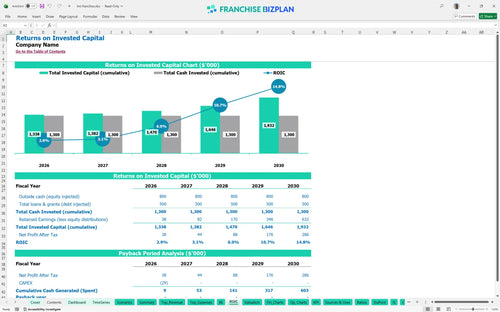
DuPont analysis
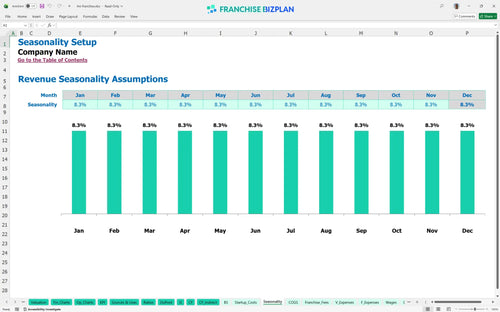
Researched revenue assumptions
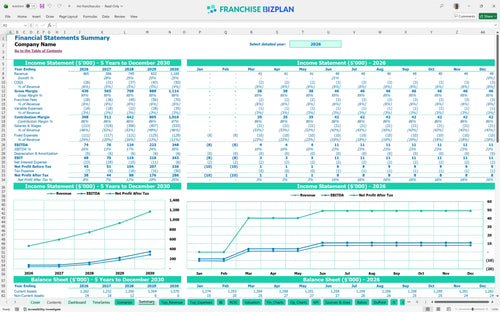
Lender-friendly financial outputs
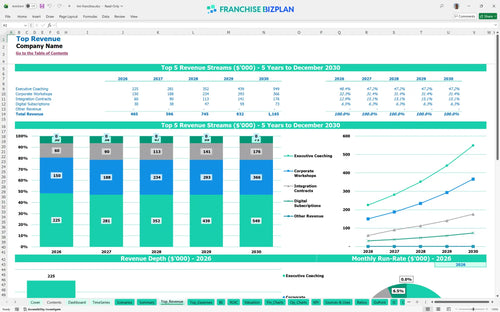
Revenue stream detailed view
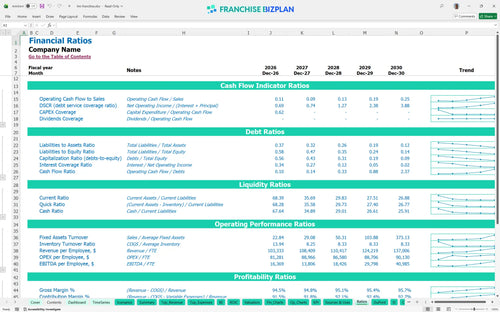
Performance metrics benchmark
We built this franchise unit financial model using our own research into the leadership development sector. Key assumptions like the $150,000 Year 1 Executive Coaching revenue and 6% royalty structure are pre-populated but fully editable to match your specific market. With a Year 1 EBITDA of $74,000, the model provides a realistic starting point for your financial feasibility study for professional services franchise.
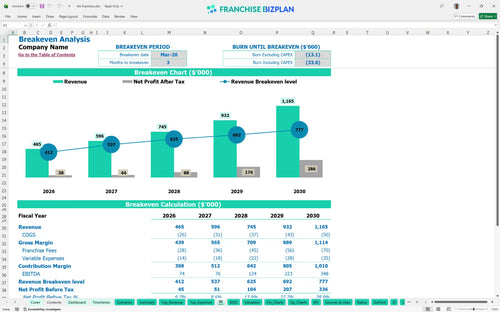
You can expect this unit to reach monthly break-even by March 2026, just three months after launching. While Year 1 EBITDA starts at $74,000, the real acceleration happens in Year 5 as revenue hits $1.16M and margins expand. Your net profit grows as you scale corporate workshops and digital subscriptions against fixed office costs.
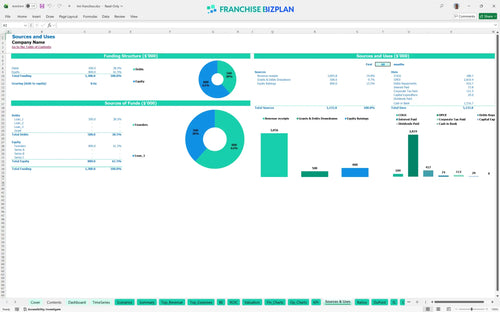
Your startup capital requirements for leadership development franchise include a $15,000 franchise fee and roughly $14,000 in other CAPEX like AV equipment and furniture. You'll also need to account for the $5,500 monthly rent and initial marketing setup. Honestly, the low build-out cost is a major plus, but you need enough working capital to carry the $55,000 Director salary until revenue ramps.
The model shows an Internal Rate of Return (IRR) of 12.35% and a Return on Equity (ROE) of 0.79. While the unit is profitable early, the full payback of your initial investment occurs after Year 5 due to the steady ramp-up of the Lead Coach and Facilitator roles. This is a long-term play focused on building a high-value client roster in the Austin tech corridor.
You hit the break-even point in March 2026, needing only three months of operations to cover your monthly fixed costs of approximately $9,500 plus salaries. The biggest driver here is your ability to secure Executive Coaching contracts early. If your sales coordinator hits their targets, you'll defintely clear the fixed cost hurdle quickly since variable costs like materials are only about 5.5% of sales.
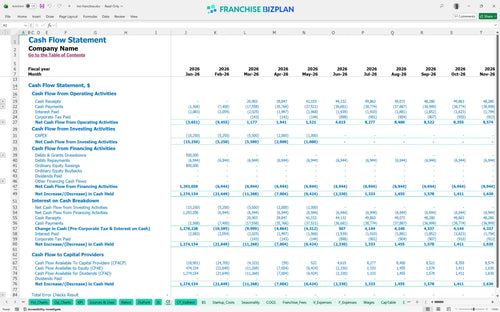
The lowest cash point occurs in December 2027, with a minimum cash balance of $1,205,000. This suggests the model assumes significant initial funding or a large cash reserve to handle the multi-year growth of the team. You need to watch your cash flow closely in Year 2 as you add a second Lead Coach and more facilitators before their revenue fully offsets their salaries.
Shifting to a high-growth scenario changes your Year 5 revenue from $1.16M to much higher levels if you model recurring revenue for B2B franchise units effectively. A low-revenue scenario would delay your payback period even further, making the $5,500 rent a heavier burden. High-case success depends on your Lead Coach's ability to maintain high billable hours while the Sales Coordinator fills the workshop funnel. Best practices for franchise revenue forecasting suggest testing these scenarios before signing your lease.
This franchise financial model template is a flexible Excel-based tool designed to let you swap out assumptions for your specific territory. You can adjust the pre-filled formulas for executive coaching rates or workshop volume to see how they impact your bottom line. It's built for the reality of a professional services unit where margins depend on billable hours and staff utilization. Plus, the Excel template for franchise unit financial planning allows you to toggle different hiring timelines for your facilitators to see the immediate impact on your monthly burn.

Planning for a long-term exit or expansion requires more than a one-year view. This model tracks your growth from a $465,000 Year 1 revenue base up to $1,165,000 by Year 5. You get a full look at how scaling your team from one Lead Coach to two impacts your store-level EBITDA (earnings before interest, taxes, depreciation, and amortization) over time. Using this financial model for multi-unit franchise expansion helps you visualize when the cash flow from your first unit can fund the launch of a second territory.

Managing royalty payments in franchise financial models is critical because they come off the top. This tool calculates the 6% royalty fee automatically against your coaching and workshop revenue streams. By modeling these obligations upfront, you can see exactly how much cash stays in the business after the franchisor takes their cut. We've also included a placeholder for marketing fund contributions, though the current structure shows a 0% marketing fee, allowing you to reallocate those funds to local Austin networking events.

Calculating break-even point for a new franchise location is the first step to sleeping better at night. With a $15,000 franchise fee and $4,000 in leasehold improvements, your initial capital expenditure (CAPEX) is relatively lean for a professional services model. This spreadsheet helps you map out every dollar needed before you open your doors at Domain Northside. It's the easiest way to learn how to calculate startup costs for a service franchise without missing hidden fees like digital platform implementation or signage.

We've baked in benchmarks for leadership development units so you aren't guessing on labor or rent. For example, the model includes a $5,500 monthly premium office rent and specific salary tiers for facilitators and sales coordinators. These numbers help you sanity-check if your local Austin costs are in line with high-end coaching expectations. Estimating operating expenses for a high-end coaching business becomes much simpler when you have a baseline for utilities, insurance, and maintenance already loaded into your projections.


Simply purchase and download the financial model template, then access it instantly using Microsoft Excel or Google Sheets. No installation or technical expertise required-just open and start working.

Enter your business-specific numbers, including revenue projections, costs, and investment details. The pre-built formulas will automatically calculate financial insights, saving you time and effort.

Leverage the investor-ready format to confidently showcase your financial projections to banks, franchise representatives, or investors. Impress stakeholders with clear, data-driven insights and professional reports.

Leverage the investor-ready format to confidently present your projections to banks, franchise representatives, or investors.