
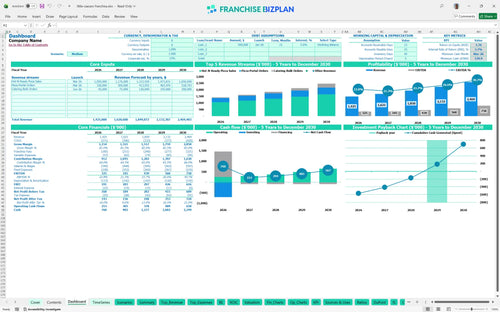
All-in-one Dashboard
Core inputs and core outputs


This comprehensive template provides a detailed roadmap for a pizza franchise unit, covering everything from initial equipment purchases to five-year EBITDA growth.
Core inputs and core outputs
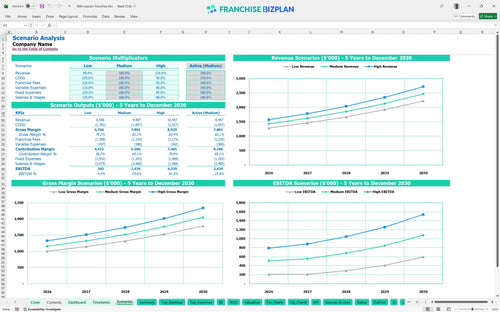
Three scenario analysis
Presentation ready
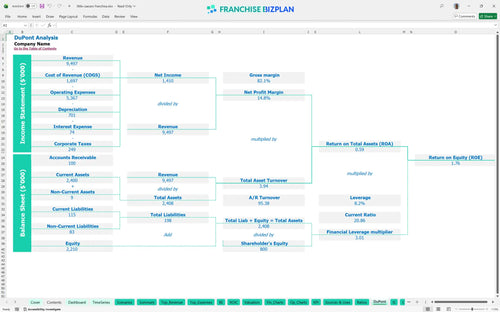
DuPont analysis
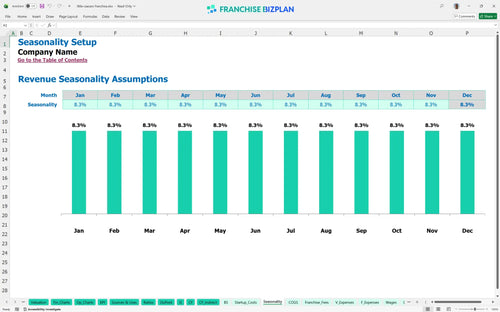
Researched revenue assumptions
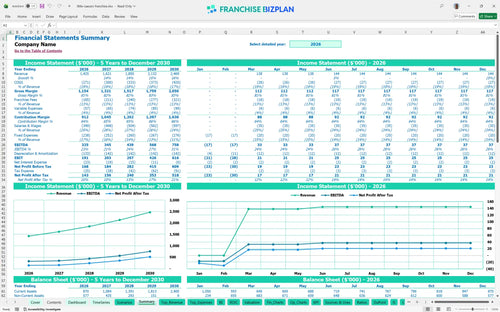
Lender-friendly financial outputs
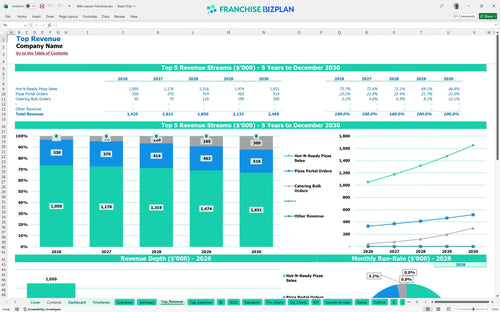
Revenue stream detailed view
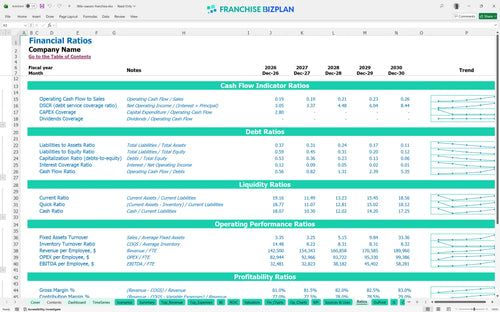
Performance metrics benchmark
We built this franchise unit financial model using our own research to ensure it reflects the high-volume reality of a modern pizza shop. Key assumptions like the $1.42M year-one revenue and 13% total franchise fees are pre-populated and fully editable to fit your specific market. This tool gives you a data-driven look at how digital portal orders and catering sales drive unit economics.
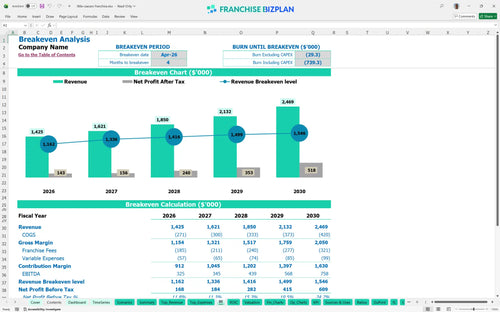
Your unit hits profitability quickly, with the model showing a break-even date in April 2026, just four months after opening. By year one, you should see $325,000 in EBITDA, which is projected to climb to $758,000 by year five as you scale catering and bulk orders. This QSR franchise profitability spreadsheet proves that high throughput is the key to your success.
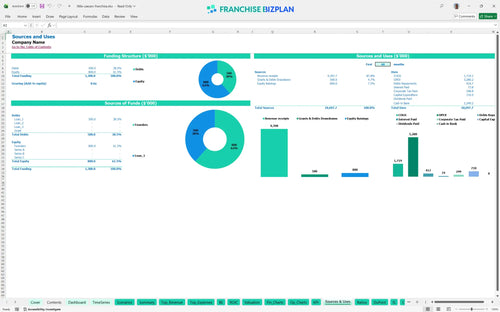
You need $710,000 to get the doors open, covering everything from the $20,000 franchise fee to $350,000 in leasehold improvements. The model also accounts for a $540,000 minimum cash buffer to handle the ramp-up phase and initial payroll. Most of your capital is allocated to the physical build-out and specialized pizza portal equipment.
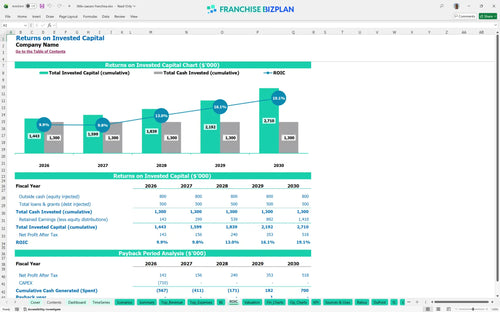
The franchise unit economic modeling guide shows a 4-year payback period for your initial investment. While the IRR is 3.67%, the steady climb in EBITDA and a 1.76 ROE suggest a stable long-term asset for a multi-unit operator. You are defintely playing a volume game where the return comes from consistent, high-traffic operations over several years.
You reach the monthly break-even level in month 4, which is fast for a quick service restaurant investment analysis. The main driver is the $700,000 in base pizza sales; if traffic dips, the $15,000 monthly rent becomes a heavy burden. You must maintain high throughput to cover the 13% combined royalty and marketing fee burden.
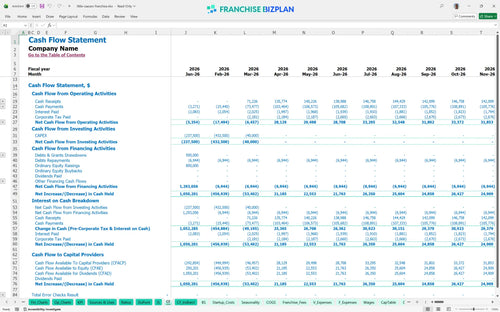
Your lowest cash point occurs in March 2026 at $540,000, right as the unit begins full operations. This means you need a solid liquidity cushion to survive the pre-opening phase and the first few weeks of staffing costs. Estimating operating expenses for a fast food franchise accurately is vital so you do not run dry before catering revenue kicks in.
Our Excel template for franchise unit financial planning lets you compare Low, Medium, and High scenarios to test your assumptions. A 10% drop in revenue in the Low case could push your payback period out by an extra year and increase peak cash needs. Conversely, hitting the High case through better local marketing execution significantly boosts your year-1 margin.
This pizza franchise financial model is built in Excel so you can tweak every variable to match your specific territory. You can adjust the $15,000 monthly rent or the 16.5% food cost assumptions to see how they impact your bottom line. It is a flexible franchise startup cost template that handles everything from dough mixers to signage with pre-filled formulas.

Plan your QSR business financial projection with confidence using a full five-year outlook that maps your growth. We track revenue scaling from $1.42M in year one to over $2.4M by year five, allowing you to see the long-term impact of catering and digital orders. This helps you visualize the transition from a new unit to a mature, high-volume operation.

Royalties and marketing funds are the standard costs of doing business that eat into your store-level margin every month. This model tracks the 6% royalty and 7% marketing fund contributions against your gross sales so you know your true take-home pay. It ensures you understand the real economics of the brand before you sign the agreement.

Knowing how to calculate startup costs for a pizza franchise is the first step to avoiding a mid-build cash crunch. With $710,000 in initial capital expenditures, including leasehold improvements and ovens, you need to know when the bleeding stops. Our model identifies the exact sales volume and time frame required to cover your fixed and variable costs.

We include built-in benchmarks for food service franchise Excel template users to sanity-check their operating assumptions. If your labor costs or food ingredients are way off the 16.5% target, the model highlights the variance immediately. This franchise unit profitability analysis keeps your projections grounded in real-world QSR performance standards.


Simply purchase and download the financial model template, then access it instantly using Microsoft Excel or Google Sheets. No installation or technical expertise required-just open and start working.

Enter your business-specific numbers, including revenue projections, costs, and investment details. The pre-built formulas will automatically calculate financial insights, saving you time and effort.

Leverage the investor-ready format to confidently showcase your financial projections to banks, franchise representatives, or investors. Impress stakeholders with clear, data-driven insights and professional reports.

Leverage the investor-ready format to confidently present your projections to banks, franchise representatives, or investors.