
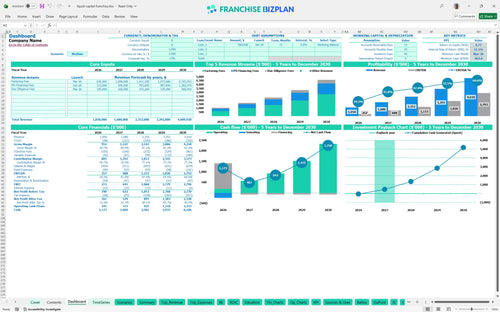
All-in-one Dashboard
Core inputs and core outputs


This comprehensive tool provides a detailed roadmap for managing capital liquidity and learning how to project revenue for a factoring business over a five-year horizon.
Core inputs and core outputs
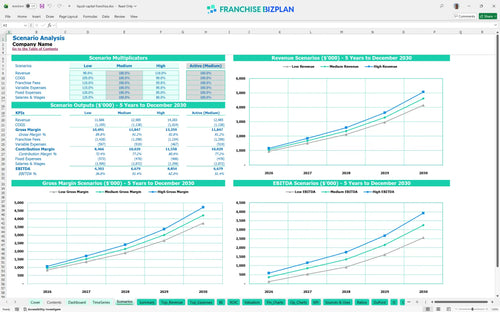
Three scenario analysis
Presentation ready
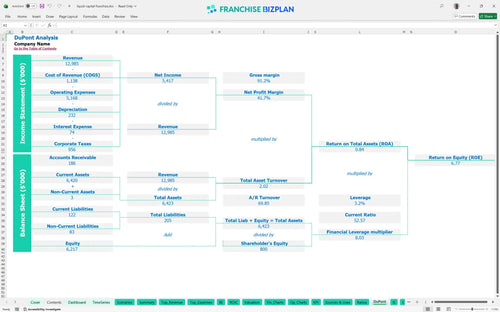
DuPont analysis
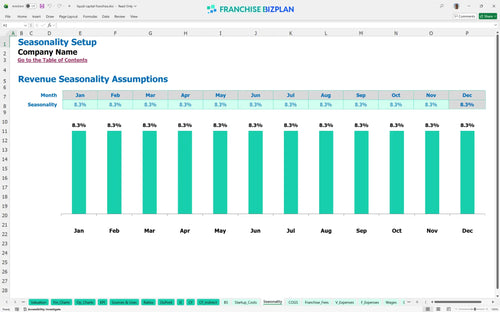
Researched revenue assumptions
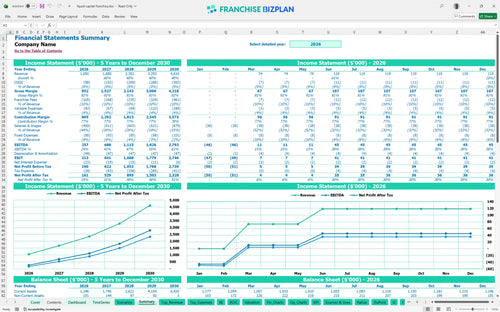
Lender-friendly financial outputs
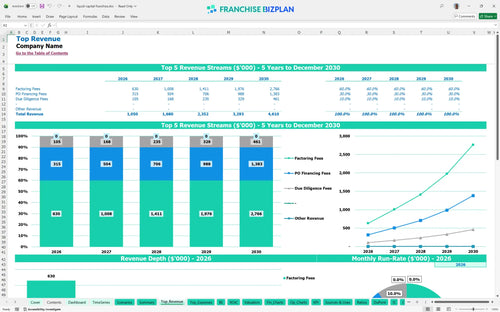
Revenue stream detailed view
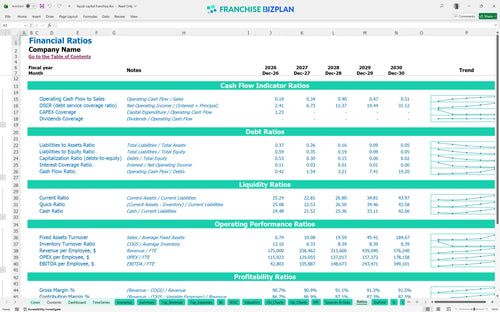
Performance metrics benchmark
We built this franchise unit financial model using our own research to ensure every assumption reflects the reality of the alternative lending space. Key drivers like factoring fees, the 8% royalty structure, and the $235,000 total capital expenditure are pre-populated and fully editable to fit your specific territory. With a projected Year 1 EBITDA of $257,000 and a 2-year payback, this model provides the data-driven confidence needed for a successful launch.
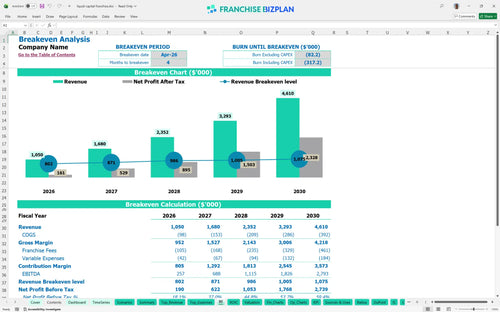
This unit hits its stride early, with a projected break-even by April 2026. With Year 1 EBITDA at $257,000 and scaling to $2,793,000 by Year 5, the factoring franchise business plan shows a strong upward trajectory after accounting for all royalties and fixed costs.
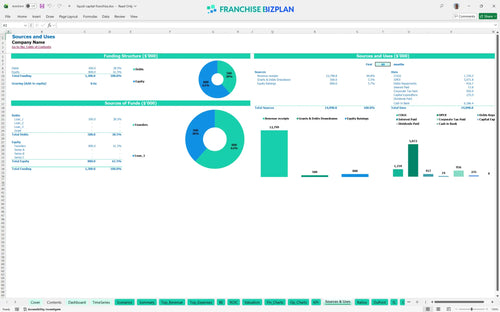
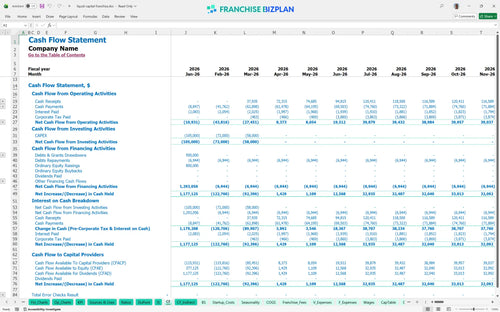
To launch this unit, you will need significant liquidity, with the lowest cash point hitting $962,000 in March 2026. The business financing franchise model allocates funds across a $55,000 franchise fee, $60,000 in leaseholds, and $30,000 for IT equipment, plus the working capital needed to fund client receivables.
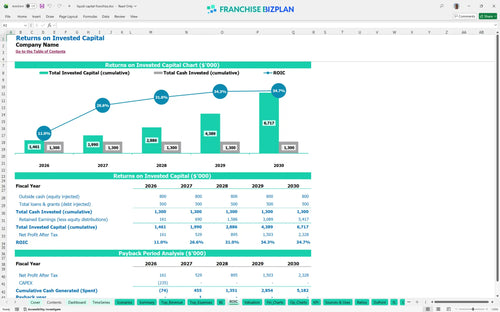
Investors can expect an Internal Rate of Return (IRR) of 11.11% and a Return on Equity (ROE) of 6.77%. The payback period is relatively quick at 2 years, which is strong for a high-volume financial services model where initial capital outlays are substantial.
The monthly break-even point occurs in April 2026, just four months after the January launch. The biggest lever for reaching this point is the volume of factoring fees, which must cover the $4,500 monthly rent and the 10% combined royalty and marketing burden.
Your lowest cash point is $962,000 in month 3, meaning you need a substantial buffer to handle the initial funding of client invoices before fees start rolling in. Capital liquidity management is the name of the game here; we recommend keeping a tight lid on early staffing until the revenue ramp is confirmed.
In the High scenario, aggressive local marketing execution could push Year 1 revenue well past $1.05 million, significantly improving the 6.77% ROE. This small business lending franchise financial forecast shows that even a 1-point shift in cost of funds or a delay in the April break-even date changes your peak cash needs.
This Excel template for franchise financial projections is fully customizable, allowing you to tweak every lever from factoring fee percentages to credit loss provisions. You can adjust the $4,500 monthly rent or the $95,000 General Manager salary to match your specific market reality. It is a flexible tool built for a factoring company startup financial model where precision in cost of funds is everything.

Planning for the long haul is critical in an alternative business funding franchise financial plan. This model provides 5-year forecasts, showing revenue scaling from $1.05 million in year one to over $4.6 million by year five. You get a clear view of the balance sheet and cash flow, ensuring you understand how purchase order funding and accounts receivable financing drive long-term value.

Managing the 8% royalty and 2% marketing fund is baked directly into the logic of this franchise unit financial performance template. Beyond the $55,000 initial franchise fee, the model tracks ongoing obligations against your gross fee income. This ensures you see the true store-level margin after the franchisor takes their cut of the due diligence and factoring fees.

Your total initial investment covers everything from the $60,000 leasehold improvements to the $30,000 IT equipment package. This franchise startup cost calculator helps you pinpoint the exact month you stop burning cash, which is projected at month 4. Understanding how to calculate startup costs for a finance franchise is the first step toward a sustainable B2B service operation.

We have included benchmarks for labor, which defintely helps when hiring your $80,000 Senior Account Manager or $60,000 Credit Underwriter. The model compares your projected 7.5% cost of funds and 1.8% credit loss provisions against industry standards for an alternative lending business. This sanity check ensures your financial model for B2B services franchise stays grounded in reality.


Simply purchase and download the financial model template, then access it instantly using Microsoft Excel or Google Sheets. No installation or technical expertise required-just open and start working.

Enter your business-specific numbers, including revenue projections, costs, and investment details. The pre-built formulas will automatically calculate financial insights, saving you time and effort.

Leverage the investor-ready format to confidently showcase your financial projections to banks, franchise representatives, or investors. Impress stakeholders with clear, data-driven insights and professional reports.

Leverage the investor-ready format to confidently present your projections to banks, franchise representatives, or investors.