
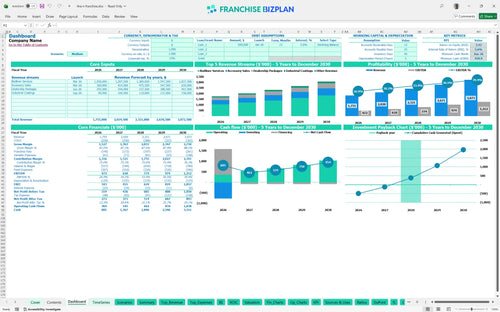
All-in-one Dashboard
Core inputs and core outputs


This comprehensive financial model includes five-year projections, startup cost breakdowns, and detailed revenue drivers for a protective coating and automotive accessory business.
Core inputs and core outputs
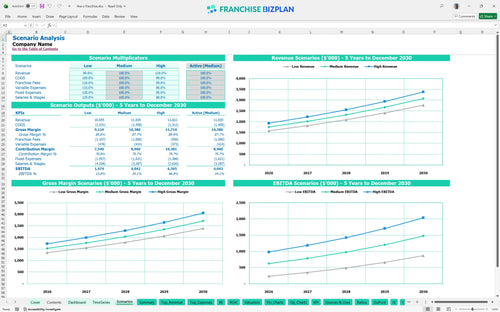
Three scenario analysis
Presentation ready
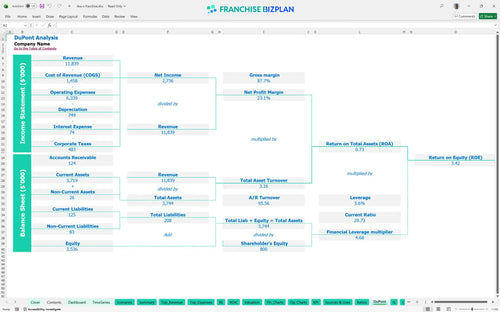
DuPont analysis
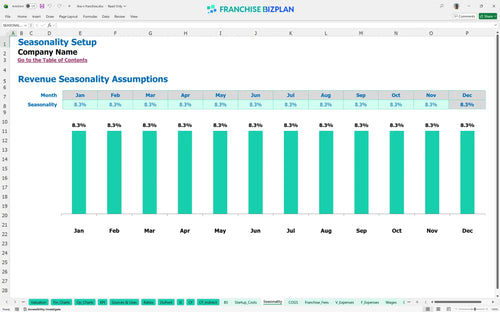
Researched revenue assumptions
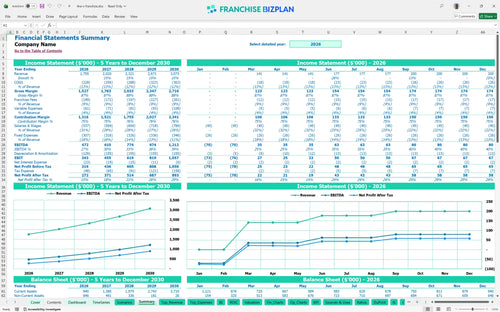
Lender-friendly financial outputs
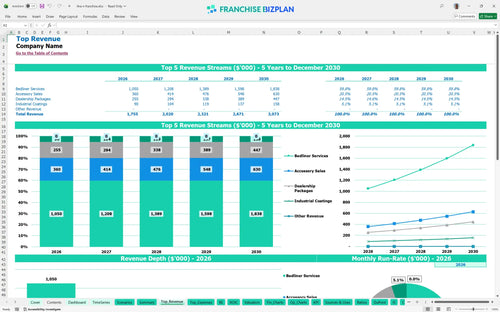
Revenue stream detailed view
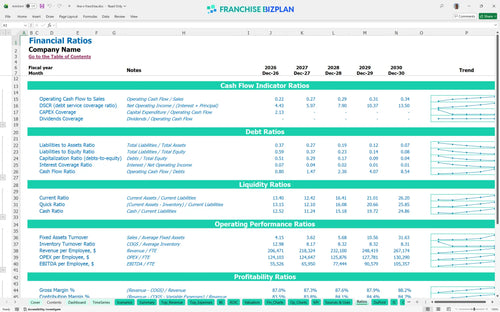
Performance metrics benchmark
We built this franchise unit financial model using our own research. Key assumptions like the $1,755,000 year-one revenue and 6% royalty fee are pre-populated with researched data specific to this protective coating franchise and are fully editable. This tool helps you move from guessing to data-driven planning by showing exactly how dealership packages and accessory sales impact your bottom line.
EBITDA is projected to grow from $472,000 in year one to over $1.2 million by year five. Using this financial model template for spray-on bed liner business, you can perform a detailed franchise profitability analysis that includes revenue projections for automotive accessory retail business. Profitability scales as you diversify into industrial coatings.
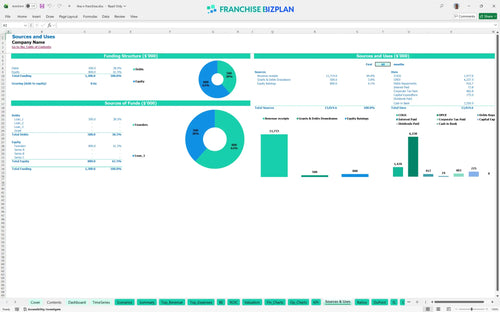
You need approximately $825,000 to launch, with $250,000 for leaseholds and $200,000 for spray equipment. This startup budget breakdown for an industrial coating franchise ensures you account for everything from the $40,000 franchise fee to the $35,000 initial chemical inventory. Equipment and leaseholds represent your biggest upfront hurdles.
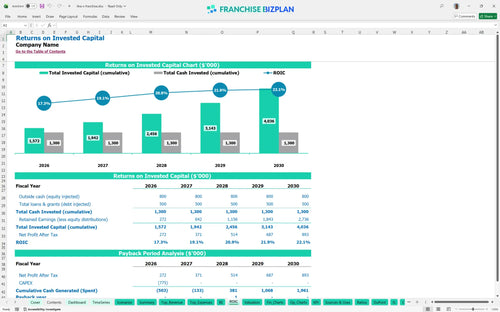
Expect a 3-year payback and a 5.63% IRR based on our franchise ROI calculation. Evaluating the profitability of a commercial fleet service franchise requires looking at these long-term yields alongside the 3.42% return on equity. A three-year payback is a solid target for this sector.
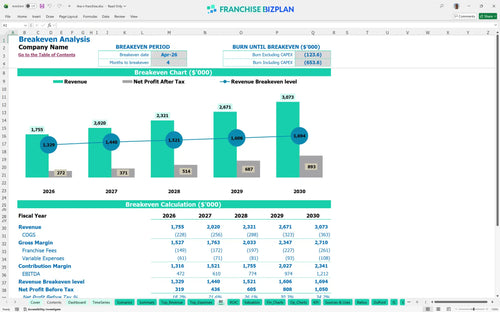
You reach break-even in April 2026, just four months after your January launch. This franchise unit break-even analysis template for small businesses shows that hitting this milestone is defintely tied to maintaining high throughput in your spray bays. Speed to break-even is the best metric for early success.
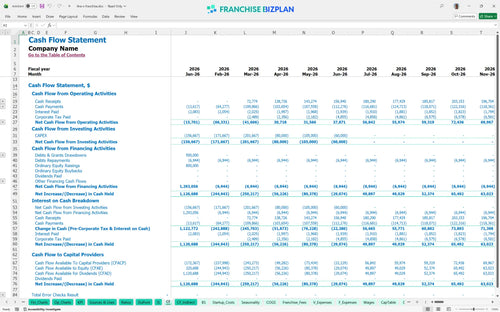
Your lowest cash point hits $460,000 in June 2026, meaning you need a solid liquidity buffer during the ramp-up. This Excel spreadsheet for franchise unit cash flow management helps you track the runway as you scale staffing to five technicians. Cash is king during the first six months of ramp-up.
High-performance scenarios can pull break-even forward by months, while lower revenue cases increase the peak cash need beyond the $460,000 mark. Adjusting your protective coating business model for these swings ensures your automotive franchise investment remains secure. Stress-testing your revenue keeps your plan realistic.
Finance: update unit break-even and payback model by Friday
This franchise financial model template is a fully editable Excel tool that lets you swap out every assumption to fit your specific market. You can use the franchise financial projection spreadsheet to adjust pricing for bedliner services or change staffing levels as your volume grows. Every formula is open for your adjustment.

This franchise business plan template provides a detailed 5-year outlook, mapping out how unit economic performance evolves from the first spray to a mature operation. You can track long-term revenue growth from $1.75M to over $3M while monitoring how cash flow stabilizes after the initial ramp-up. Watch your business grow from day one to year five.

Analyzing net profit margins for automotive service franchises is much easier when you can see exactly how the 6% royalty and 2.5% marketing fund impact your bottom line. This model tracks every franchise-specific obligation, from the initial $40,000 fee to ongoing brand contributions, so you understand the true cost of the system. Royalties are calculated automatically based on your sales.

Our franchise startup cost calculator breaks down the $250,000 leasehold and $200,000 equipment costs so you know exactly what is required before opening. How to calculate startup costs for an automotive franchise becomes clear when you see the total investment mapped against your break-even sales targets. Know your walk-in costs before you sign the lease.

Following best practices for franchise unit financial forecasting, this model includes built-in benchmarks for labor and occupancy. Estimating operating expenses for a protective coating franchise is simpler when you can compare your $15,000 monthly rent or technician wages against industry standards. Compare your numbers against real automotive service standards.


Simply purchase and download the financial model template, then access it instantly using Microsoft Excel or Google Sheets. No installation or technical expertise required-just open and start working.

Enter your business-specific numbers, including revenue projections, costs, and investment details. The pre-built formulas will automatically calculate financial insights, saving you time and effort.

Leverage the investor-ready format to confidently showcase your financial projections to banks, franchise representatives, or investors. Impress stakeholders with clear, data-driven insights and professional reports.

Leverage the investor-ready format to confidently present your projections to banks, franchise representatives, or investors.