


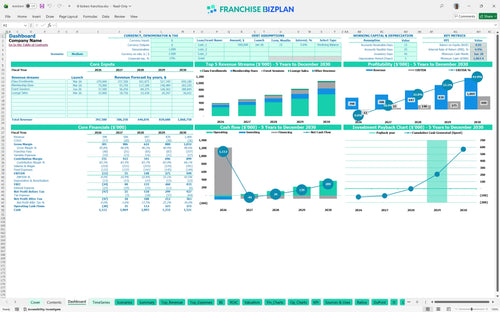
All-in-one Dashboard
Core inputs and core outputs



This franchise unit financial model template provides a complete toolkit for forecasting revenue, managing overhead, and calculating ROI for a new territory.
Core inputs and core outputs
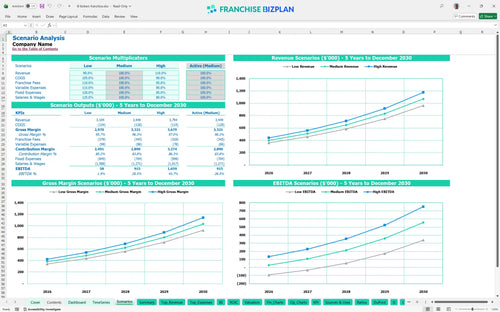
Three scenario analysis
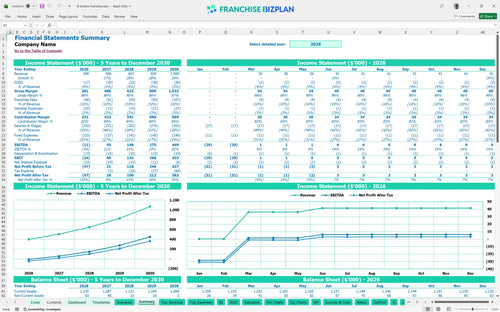
Presentation ready

DuPont analysis
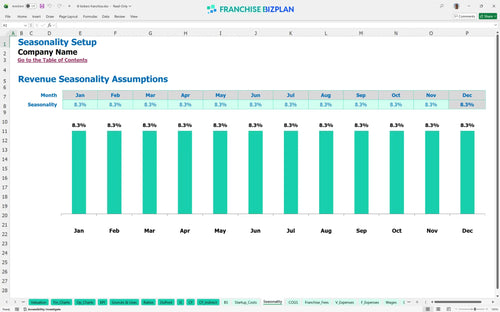
Researched revenue assumptions
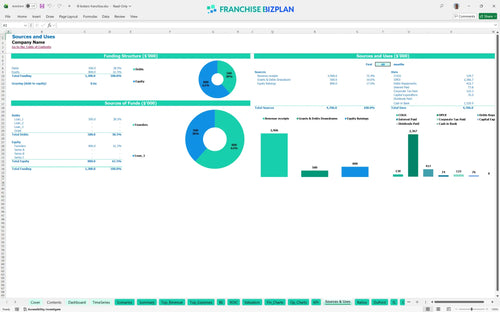
Lender-friendly financial outputs

Revenue stream detailed view
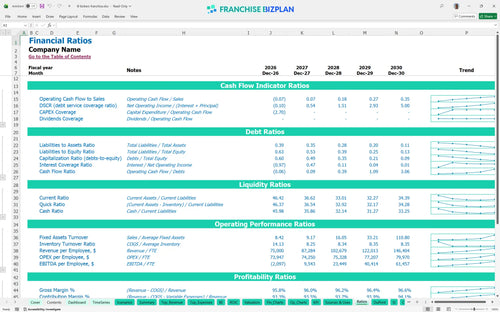
Performance metrics benchmark
We built this franchise unit financial model using our own research to ensure your operating expense forecasting is grounded in reality. Key assumptions like the 9% royalty fee and $398,000 year-one revenue target are pre-populated and fully editable to fit your specific market. With a projected breakeven in June 2026, this tool helps you visualize the path from initial fit-out to a $449,000 EBITDA by year five.
This franchise profitability analysis indicates the unit reaches a positive EBITDA of $55,000 in year two, following a ramp-up phase in year one. By year five, as class enrollments and membership dues mature, the model projects annual earnings reaching $449,000 after all royalties and fixed costs.
The total initial investment covers the $25,000 franchise fee and approximately $51,000 in equipment and fit-out costs. You will need a total startup budget that includes the $12,000 turf flooring and $10,000 facility fit-out to meet brand standards before the March 2026 launch.
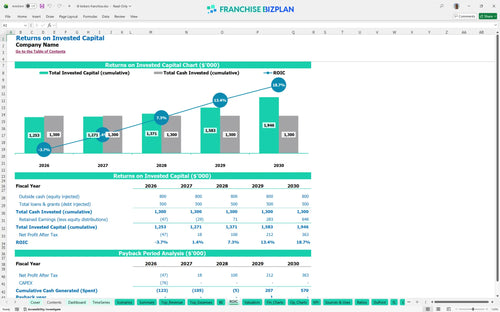
The model estimates an internal rate of return (IRR) of 4.9% with a payback period of 4 years. While the return on equity (ROE) stands at 0.81, the long-term value is driven by the scaling revenue which hits $1,069,000 by the fifth year of operation.
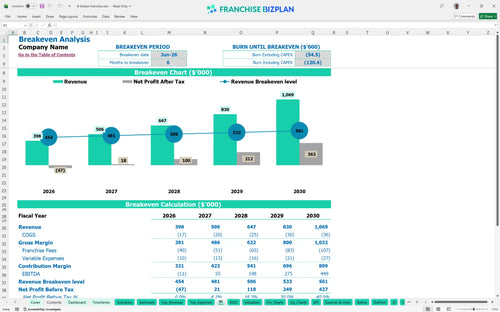
You reach the monthly break-even point in June 2026, just six months after opening the doors. The primary driver for this timeline is maintaining class enrollment volume to cover the $6,500 monthly rent and the 9% royalty fee burden.
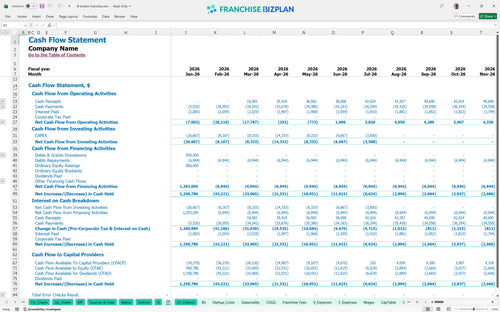
The lowest cash point occurs in early 2028, showing a minimum cash balance of $1,063,000 based on initial funding levels. You defintely want to monitor the six-month ramp-up closely, as any delay in the March launch could strain your working capital reserves.
A High scenario improves the year-one margin by increasing the average ticket through lounge sales and event sessions. In contrast, the Low case shows that if revenue stays near the $398,000 year-one mark too long, the fixed costs like the $1,400 utility bill will erode profitability. Finance: update unit break-even and payback model by Friday.
This franchise business plan Excel tool is built for total flexibility, allowing you to tweak every assumption from class sizes to coach wages. You can adjust the pre-filled formulas to match your specific territory or real estate costs, making it a reliable franchise investment calculator for your unit planning.

Mapping out a five-year horizon helps you see the transition from a startup facility to a mature youth activity center. The model tracks how revenue scales from $398,000 in year one to over $1 million by year five, providing a clear franchise profitability analysis for long-term growth.

Running a franchise means managing recurring costs like a 9% royalty fee and a 1% marketing fund contribution. This model calculates these obligations automatically based on your gross sales, ensuring you see the true net margin after the franchisor takes their cut.

Knowing how to calculate startup costs for a kids sports franchise is the first step to avoiding a cash crunch. We include everything from the $25,000 initial fee to the $12,000 turf and flooring costs, plus a break-even analysis to show exactly when your monthly revenue covers your $6,500 rent and payroll.

Use our built-in benchmarks to see if your $50,000 facility manager salary or 3.2% program supply cost aligns with typical indoor youth sports facility standards. These guardrails help you spot margin leaks early and ensure your unit economics stay competitive within the youth enrichment sector.


Simply purchase and download the financial model template, then access it instantly using Microsoft Excel or Google Sheets. No installation or technical expertise required-just open and start working.

Enter your business-specific numbers, including revenue projections, costs, and investment details. The pre-built formulas will automatically calculate financial insights, saving you time and effort.

Leverage the investor-ready format to confidently showcase your financial projections to banks, franchise representatives, or investors. Impress stakeholders with clear, data-driven insights and professional reports.

Leverage the investor-ready format to confidently present your projections to banks, franchise representatives, or investors.