
All-in-one Dashboard
Core inputs and core outputs


This comprehensive toolkit provides a retail franchise unit economic performance metrics dashboard, a cash flow management tracker, and a full ROI analysis to guide your investment decision.
Core inputs and core outputs
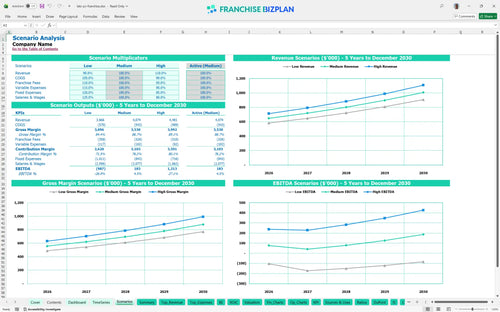
Three scenario analysis
Presentation ready
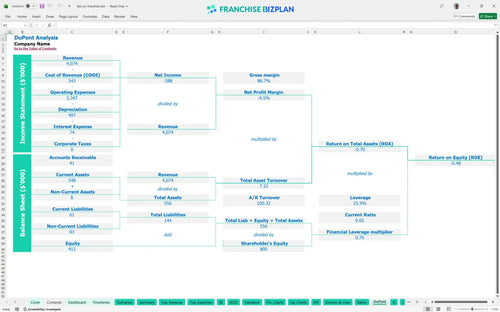
DuPont analysis
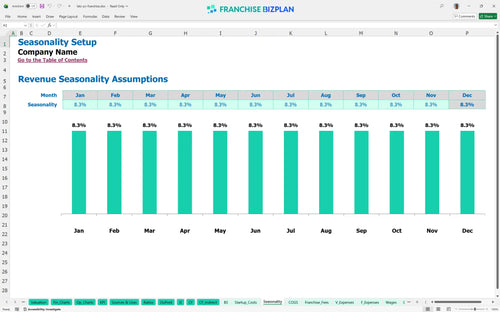
Researched revenue assumptions
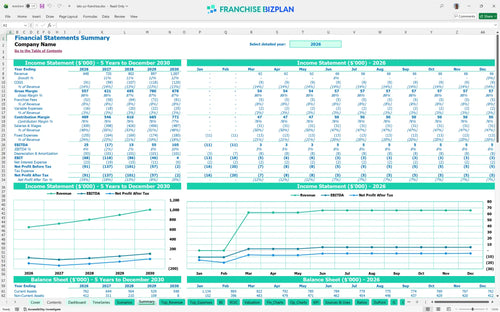
Lender-friendly financial outputs
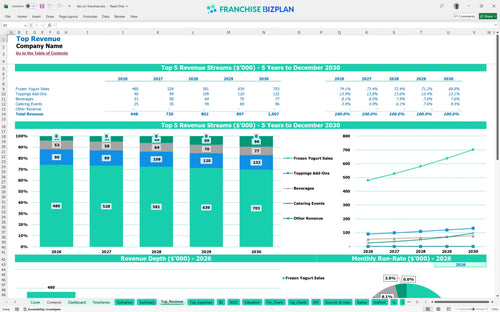
Revenue stream detailed view
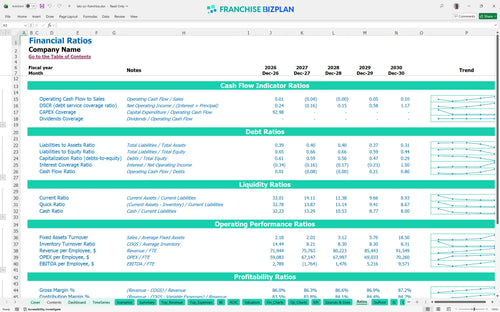
Performance metrics benchmark
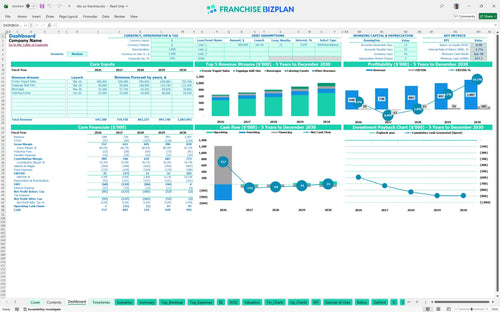
We built this franchise unit financial model using our own research into self-serve dessert concepts. Key assumptions, including the $9,500 monthly rent and $505,000 in total equipment and build-out costs, are pre-populated and fully editable. You can perform a detailed frozen yogurt shop profit margin analysis by tracking how revenue scales from $648,000 to $1,007,000 while managing a 10-person crew and 8% total franchise fees.
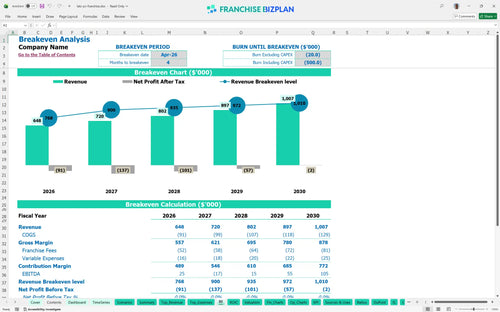
This unit sees an initial EBITDA of $25,000 in year one, but faces a dip to -$17,000 in year two as crew costs and assistant manager salaries scale. Profitability is defintely a long-term play here, with EBITDA recovering to $15,000 in year three and reaching $105,000 by year five. This franchise unit profitability depends on scaling catering events and maintaining tight control over the 11.5% ingredient COGS.
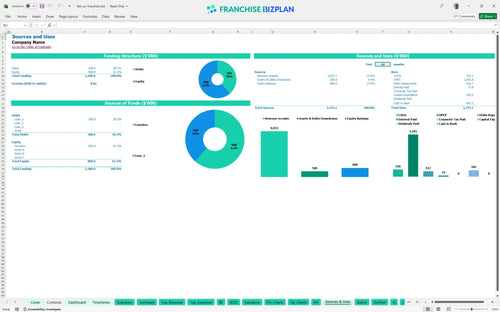
To launch this unit in the US, you need approximately $505,000 in initial capital plus a significant cash buffer. This includes a $45,000 franchise fee, $220,000 for leasehold improvements, and $95,000 for specialized yogurt machines. Knowing how to calculate startup costs for a frozen yogurt franchise is critical because your startup capital requirements must also cover the $478,000 minimum cash needed to survive the ramp-up period.
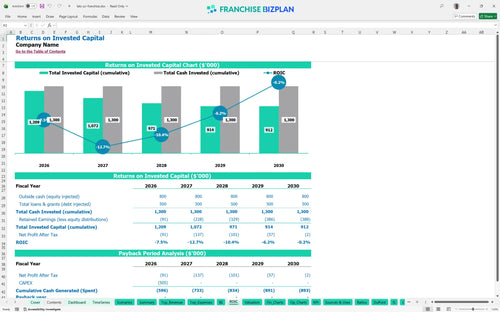
The model shows an IRR of -2.71% and a negative ROE of -0.48% over the first five years, with a payback period extending beyond the five-year mark. While the year-five EBITDA of $105,000 is healthy, the high initial build-out costs and year-two dip slow the ROI analysis significantly. Success requires aggressive local marketing to beat the $1M revenue forecast and shorten the payback timeline.
The unit reaches its monthly break-even point in April 2026, just four months after launching. This quick operational break-even is a result of the self-serve model, but the operational expense forecast shows that staying profitable requires high volume to cover the $13,300 in monthly fixed costs (rent, utilities, and insurance). Labor is your biggest lever, as a 10-person crew can quickly erode margins if throughput stays low.
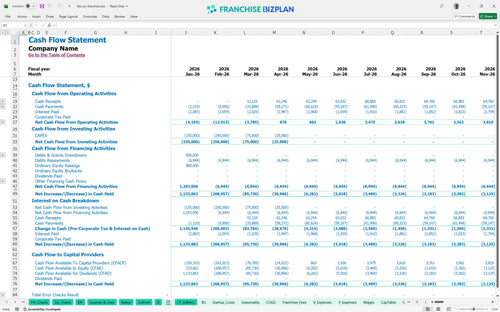
The lowest cash point hits $478,000 in January 2030, meaning you need substantial liquidity to handle the multi-year ramp. Since year two shows an EBITDA loss, your cash flow management must be airtight to avoid running out of runway before the unit matures. We recommend a 20% additional cash buffer beyond the initial build-out to handle slower-than-expected winter months.
The difference between a $648k year-one and the $1M year-five target depends on local marketing execution and throughput. Using the franchise unit performance evaluation spreadsheet, you can see that a 10% drop in traffic would likely push the -2.71% IRR further into the red. Conversely, hitting the high-growth scenario through catering and social media loyalty could potentially bring payback within the 5-year window.
Use this financial model for self-serve yogurt store planning to verify if the $505,000 in hard costs fits your budget. Preparing a financial forecast for a new franchise location is the only way to see if the $105,000 year-five EBITDA justifies the risk. Finance: update unit break-even and payback model by Friday.
This franchise unit financial model is fully customizable in Excel, with pre-filled formulas and editable assumptions that make it easy to adapt to a specific franchise concept, location, and operating scenario. It serves as the best Excel template for franchise financial planning by allowing you to swap out costs and revenue drivers in real-time. You can easily adjust the frozen yogurt franchise business plan to reflect your specific territory and local market conditions.

Map out your long-term growth with detailed 5-year revenue, cost, cash flow, and profit projections tailored for a franchise unit or small franchise chain. These retail franchise financial projections show your path from a $648,000 year-one revenue to over $1 million by year five. Having a multi-year view helps you anticipate the timing gaps between opening costs and mature-unit performance.

This model captures franchise-specific financial obligations, including upfront franchise fees, royalty payments, and brand marketing fund contributions, so buyers can understand the real economics of operating the unit. Estimating franchise royalty and marketing fees is automated based on your revenue forecasts, ensuring you never overlook the 6% royalty or 2% brand fund impact on your store-level margin. This transparency is vital for any franchise financial model template.

Use the franchise startup cost calculator to estimate your total initial investment, monthly cost structure, and the sales level required to cover fixed and variable costs. Calculating break-even point for a franchise is simplified here, showing you exactly when your $9,500 monthly rent and labor expenses are covered by yogurt and topping sales. This tool helps you plan for the $505,000 in hard startup costs before you break ground.

The model incorporates built-in franchise and industry benchmarks for key operating and financial metrics, helping users sanity-check assumptions and compare expected performance against typical ranges. These financial planning tools for new franchise owners allow you to compare your 11.5% yogurt ingredient costs against industry norms. Using a small business franchise spreadsheet with these benchmarks prevents unrealistic expectations during the planning phase.


Simply purchase and download the financial model template, then access it instantly using Microsoft Excel or Google Sheets. No installation or technical expertise required-just open and start working.

Enter your business-specific numbers, including revenue projections, costs, and investment details. The pre-built formulas will automatically calculate financial insights, saving you time and effort.

Leverage the investor-ready format to confidently showcase your financial projections to banks, franchise representatives, or investors. Impress stakeholders with clear, data-driven insights and professional reports.

Leverage the investor-ready format to confidently present your projections to banks, franchise representatives, or investors.