


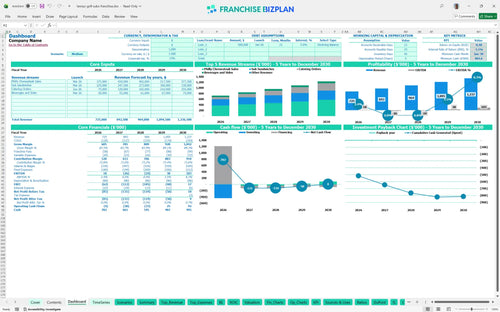
All-in-one Dashboard
Core inputs and core outputs



This tool provides a complete franchise unit pro forma financial statement template including detailed revenue streams, payroll schedules, and a full capital expenditure budget.
Core inputs and core outputs
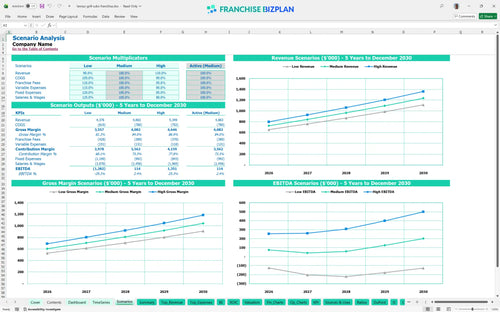
Three scenario analysis
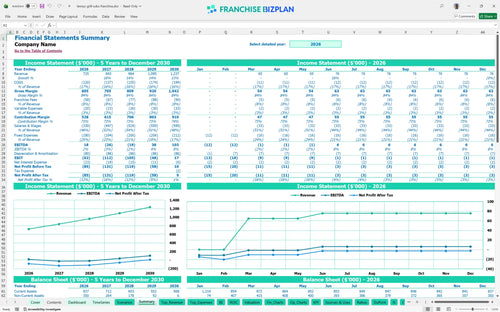
Presentation ready
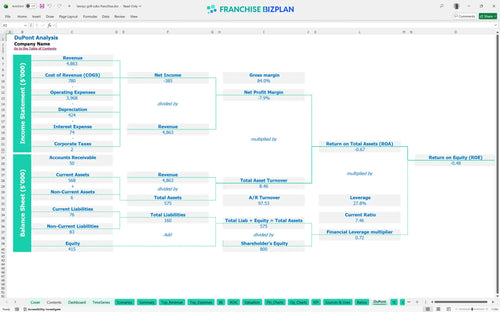
DuPont analysis
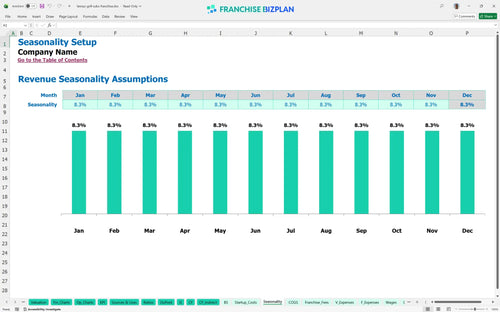
Researched revenue assumptions
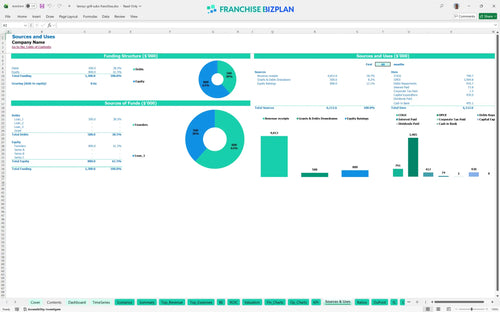
Lender-friendly financial outputs
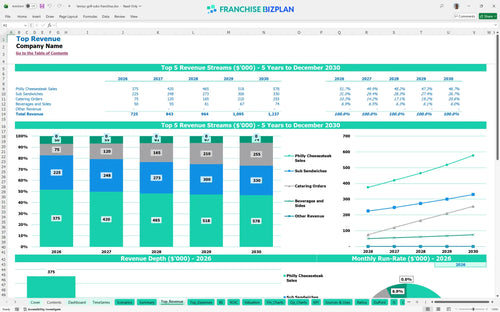
Revenue stream detailed view
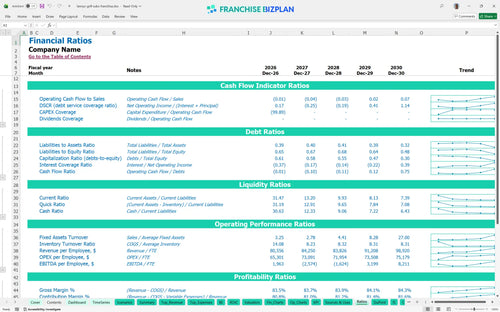
Performance metrics benchmark
We built this financial model template for fast food franchise owners using detailed research on sub shop operations. Key assumptions like the 6% royalty rate and $10,000 monthly rent are pre-populated and fully editable to match your specific location. Here is the quick math: you are looking at a year-one revenue target of $725,000 with a path to $1.23 million by year five.
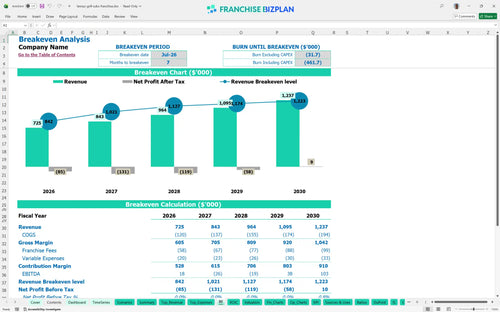
This franchise unit reaches operational break-even in July 2026, just seven months after launching. While year one shows a modest $18,000 EBITDA, you will face some margin pressure in years two and three before hitting a stronger $103,000 profit by year five as catering revenue scales. Profitability is a marathon, not a sprint.
How to calculate startup costs for a sub shop franchise starts with the $25,000 franchise fee and $200,000 in leasehold improvements. Your total capital expenditure budget also includes $100,000 for kitchen equipment and $30,000 for POS systems, requiring a $485,000 minimum cash position to handle the ramp-up. You need enough gas in the tank to reach cruising altitude.
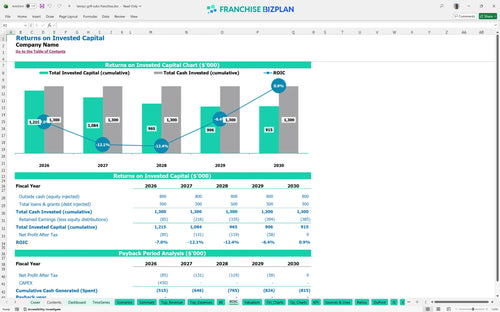
The financial feasibility study for new franchise locations shows an IRR of -3.08% over the first five years, with a payback period extending beyond year five. While the ROE is -0.48, the steady revenue climb suggests that long-term value is tied to store-level execution and local market density. Patience is required for this specific asset class.
You hit the break-even point in July 2026, meaning you need seven months of trading to cover your $10,000 monthly rent and fixed overhead. The model shows that Philly cheesesteak sales, projected at $250,000 in year one, are the primary driver for meeting these fixed obligations. Every sandwich counts toward your survival goal.
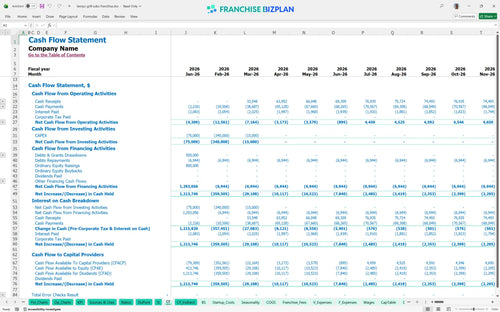
Your lowest cash point hits in January 2030 at $485,000, which suggests you defintely need to maintain a significant reserve to handle the middle-year EBITDA dips. Best practices for restaurant franchise financial planning dictate that you keep a tight grip on your operating expense forecast during the 2027-2028 period. Cash is the lifeblood of your sub shop.
A franchise profitability analysis shows that hitting the high-growth scenario depends heavily on estimating catering revenue for restaurant franchises accurately. If catering hits $170,000 by year five, your EBITDA jumps to $103,000, but a 10% drop in volume across the board would significantly delay your return on investment calculation. Small changes in traffic lead to big changes in take-home pay.
This franchise unit financial model template is built in Excel with fully editable assumptions, letting you swap out local rent or labor rates in seconds. All formulas are pre-filled so you can focus on testing different what-if scenarios for your specific territory without building a spreadsheet from scratch. It is a plug-and-play tool for any serious operator.

Map out your growth from a $725,000 year-one start to a projected $1.23 million by year five. These food service financial projections cover everything from daily sandwich counts to annual tax obligations, giving you a clear view of your cash flow management needs over a half-decade. Long-term planning is the only way to survive the early ramp-up years.

Managing variable operating costs in a sub franchise starts with tracking the 6% royalty and 2% marketing fee against every dollar of gross sales. This model automates those calculations, ensuring you see the exact impact of brand obligations on your store-level margin before you sign a lease. Don't let corporate fees surprise your bank account.

Use our restaurant franchise break even analysis template to see exactly when your unit stops burning cash and starts generating it. With a $200,000 leasehold improvement budget and $100,000 in kitchen equipment, knowing your monthly volume target is critical for survival. Knowing your number helps you sleep better at night.

We have baked in franchise unit economics benchmarks to help you spot red flags in your restaurant franchise profit and loss statement example. If your food ingredients cost exceeds the 14% target or labor gets bloated, the model highlights the variance so you can adjust operations before margins erode. Benchmarks keep your assumptions grounded in reality.


Simply purchase and download the financial model template, then access it instantly using Microsoft Excel or Google Sheets. No installation or technical expertise required-just open and start working.

Enter your business-specific numbers, including revenue projections, costs, and investment details. The pre-built formulas will automatically calculate financial insights, saving you time and effort.

Leverage the investor-ready format to confidently showcase your financial projections to banks, franchise representatives, or investors. Impress stakeholders with clear, data-driven insights and professional reports.

Leverage the investor-ready format to confidently present your projections to banks, franchise representatives, or investors.