
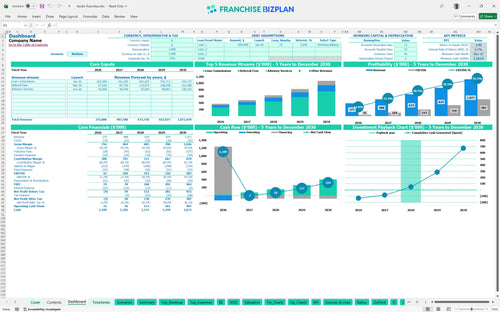
All-in-one Dashboard
Core inputs and core outputs


This Excel spreadsheet for franchise financial planning provides a complete, data-driven look at your future business performance from day one through year five.
Core inputs and core outputs
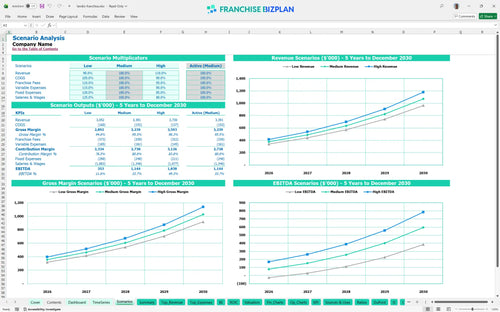
Three scenario analysis
Presentation ready
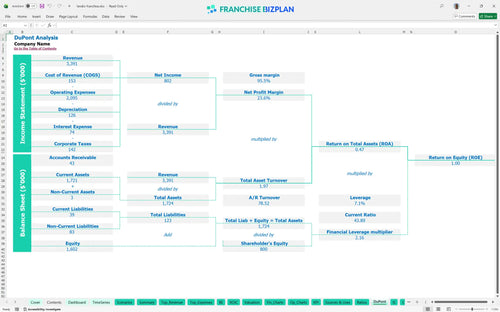
DuPont analysis
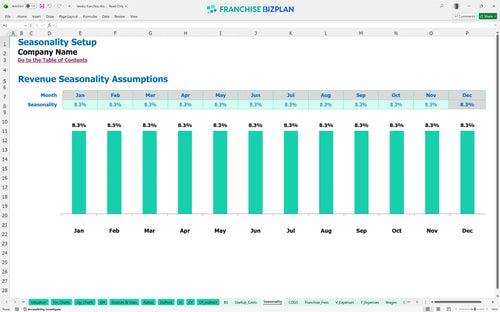
Researched revenue assumptions
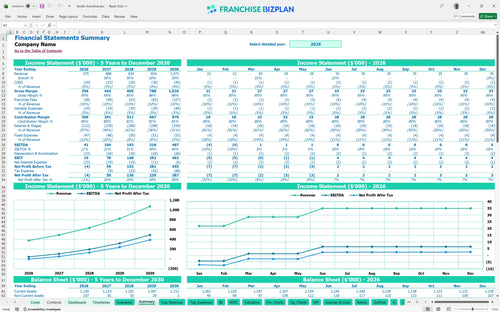
Lender-friendly financial outputs
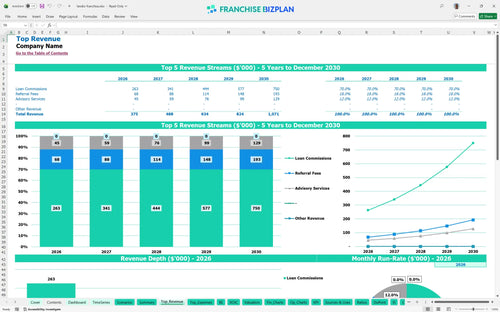
Revenue stream detailed view
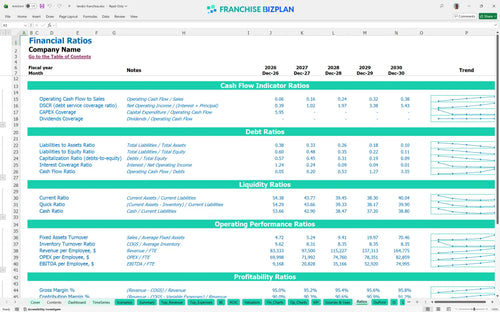
Performance metrics benchmark
We built this franchise unit financial model using our own research into the service-based lending sector. Key assumptions like Loan Commissions, Referral Fees, and Advisory Services are pre-populated alongside costs like the $46,000 franchise fee and 8% royalty. With Year 1 EBITDA projected at $41,000, this model gives you a credible starting point for your franchise profitability analysis.
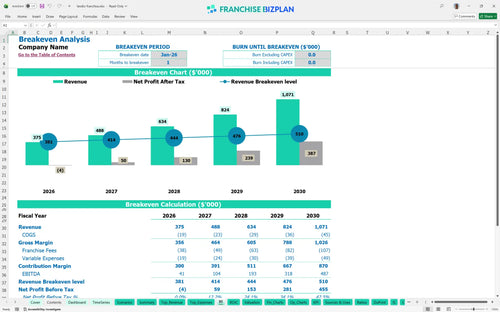
Profitability arrives almost immediately in this model, with breakeven occurring in January 2026. After accounting for the 8% royalty and 2% marketing fees, EBITDA scales from $41,000 in Year 1 to $487,000 by Year 5. This rapid climb depends on hitting your loan commission targets as you ramp up operations.
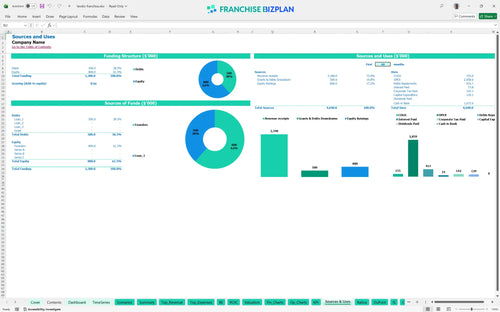
You will need approximately $129,100 in startup capital requirements to launch this unit. This covers the $46,000 franchise fee, a $25,000 office buildout, and $18,000 for IT and computers. The model ensures you have the right startup budget template for local service franchise success in the US market.
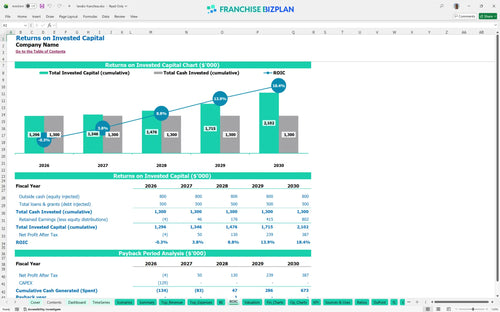
The franchise investment return calculator template shows an IRR of 5.69% and a 3-year payback period. While the initial return is steady, the Year 5 EBITDA of $487,000 suggests significant long-term value for a multi-unit operator. Your ROE is projected at 1, reflecting a stable equity position once the unit matures.
The unit hits the monthly break-even point in just 1 month, specifically by January 2026. This is driven by the low fixed overhead of $2,800 for rent and a lean starting team. To keep this timeline, you must maintain a steady flow of loan commissions to offset the 10% total fee burden to the franchisor.
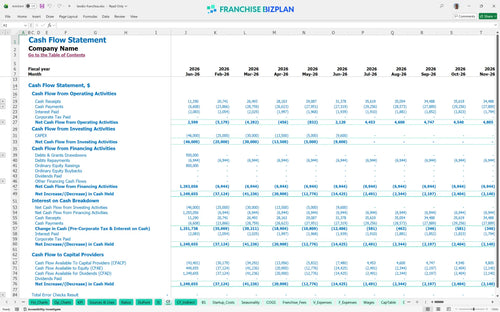
The lowest cash point is defintely at the start, but the model shows a minimum cash balance of $1,102,000 by December 2027. This indicates a very strong cash runway once the initial $129,100 investment is deployed. You should still keep a 3-month buffer for fixed costs like the $13,833 monthly payroll to handle any funding delays.
In a High scenario, Year 1 revenue exceeds $375,000, which significantly pulls forward your ROI analysis. Because fixed costs like the $55,000 manager salary don't change with volume, every extra loan closed adds directly to your store-level margin. The Low case would test your ability to carry the $2,800 rent during slow funding months.
Finance: update unit break-even and payback model by Friday.
This franchise financial model is built in Excel to give you total control over your numbers. You can swap out pre-filled formulas and editable assumptions to match your specific territory, local rent prices, and actual hiring timelines without breaking the logic. It is a flexible business financial projections tool designed for real-world adjustments.

Planning for the long haul requires more than a simple spreadsheet. This model delivers 5-year revenue, cost, and cash flow forecasting to help you see how the unit scales from a $375,000 Year 1 to over $1 million by Year 5. It provides a clear roadmap for multi-unit growth or a single-unit exit strategy.

The model tracks every dollar owed to the brand, including the 8% royalty and 2% marketing fund contributions. By factoring in the initial $46,000 franchise fee alongside ongoing obligations, you get a realistic view of your store-level margin. Understanding these franchise startup costs is vital for maintaining a healthy relationship with your franchisor.

Stop guessing how much cash you need to reach daylight. This tool includes a detailed startup budget template for local service franchise operations, covering everything from the $25,000 office buildout to IT equipment. It calculates the exact sales volume needed to cover your $2,800 monthly rent and payroll, providing a clear franchise unit profit and loss projection.

We have integrated industry-specific data so you can perform a financial feasibility study for franchise owners with confidence. Compare your $55,000 manager salary and regulatory compliance costs against typical service franchise benchmarks. This helps you identify if your labor or occupancy costs are out of sync with the rest of the chain.


Simply purchase and download the financial model template, then access it instantly using Microsoft Excel or Google Sheets. No installation or technical expertise required-just open and start working.

Enter your business-specific numbers, including revenue projections, costs, and investment details. The pre-built formulas will automatically calculate financial insights, saving you time and effort.

Leverage the investor-ready format to confidently showcase your financial projections to banks, franchise representatives, or investors. Impress stakeholders with clear, data-driven insights and professional reports.

Leverage the investor-ready format to confidently present your projections to banks, franchise representatives, or investors.